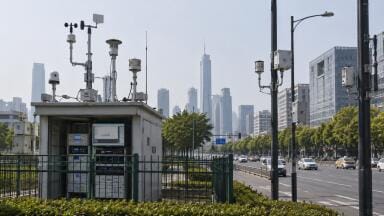
Air quality monitoring
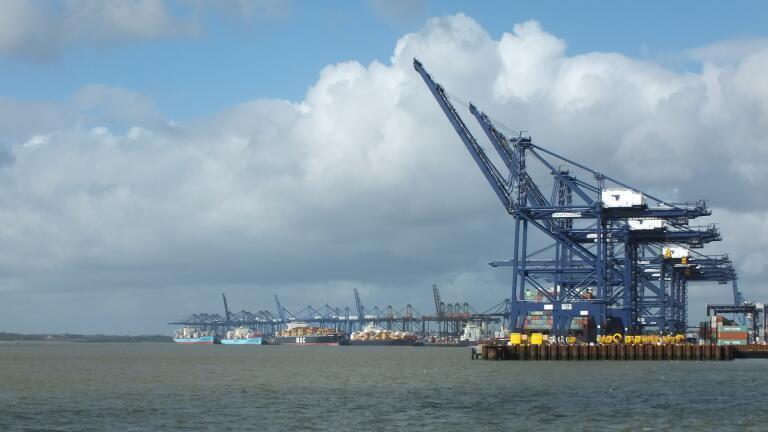
A new European Environment Agency (EEA) briefing on air quality around ports and airports makes a simple but important claim.
These hubs are emerging air quality hotspots, and current monitoring networks often are not designed to capture their full impact.
For environmental monitoring professionals, the report is both a warning and a roadmap.
At its core, the briefing links three trends.
First, nitrogen oxides (NOₓ) and particulate emissions from maritime transport and aviation are rising in relative importance compared with other transport modes.
Second, many ports and airports already show higher concentrations of key pollutants than surrounding regions, in some cases exceeding the EU’s revised 2030 limit values.
Third, the monitoring networks placed around these hubs are frequently sparse, poorly oriented with respect to prevailing winds and inconsistent in how they address emerging pollutants such as ultrafine particles (UFPs).
Together, these trends point to a clear conclusion: if ports and airports are going to be treated as air quality hotspots in regulation, they must first be treated as such in monitoring design.
In 2022, transport generated more than half of all NOₓ emissions in the EU-27 and close to a third of PM₁₀ and PM₂.₅.
Within that total, the profile is changing. NOₓ emissions from maritime transport in the EU-27 rose by 10% between 2015 and 2023, and shipping now accounts for 39% of all transport NOₓ emissions.
Its contribution to PM₂.₅ in transport has also remained high, peaking at 43% in 2019 and staying at similar levels since.
Shipping’s relative role is expected to keep growing.
The EEA projects that in coastal cities, maritime transport will overtake road traffic as the leading source of transport-related air pollution and associated health impacts by 2030.
Aviation is following its own upward trend.
Domestic and international aviation contributed around 14% of transport NOₓ emissions in 2022.
Between 1990 and 2022, aviation emissions of NOₓ, sulphur oxides, ammonia and particulate matter increased by roughly 47–117%, depending on the pollutant.
Only a few pollutants, such as methane, carbon monoxide and non-methane VOCs, show declining trends.
Against this background, the EEA frames ports and airports not just as logistics hubs but as complex emissions clusters.
Alongside ships and aircraft, these sites host intense road traffic, ground service equipment, non-road machinery, bulk handling, storage and often nearby industrial installations.
Measuring their air-quality footprint requires monitoring approaches that can cope with this complexity.
The revised EU Ambient Air Quality Directive, to be met by 2030, tightens limit values and aligns them more closely with World Health Organization recommendations.
It also formalises the idea of air quality hotspots.
These are locations with particularly high pollution levels that require specific monitoring efforts, explicitly including ports and airports among other local sources.
For ports and airports, the Directive sets out clear expectations for network design.
At least one sampling point should be placed downwind of the main source in the predominant wind direction, in the nearest residential area.
If background concentrations are unknown, an additional upwind sampling point is required.
Air quality zones that exceed the new limit values will have to produce air quality roadmaps, including concrete measures to reduce pollution.
This regulatory framing matters because it treats monitoring design as a central part of compliance.
It is no longer enough for ports and airports to sit within a wider urban network; their specific contribution has to be assessed and, where necessary, managed.
The briefing analyses 22 major European ports using both monitoring data and EEA air quality maps at 1 km resolution. The picture is uneven.
For NO₂, some ports such as Amsterdam and Antwerpen are relatively well covered, with many sampling points (SPOs) within 5–10 km and monitoring stations in most wind sectors. Others, like Reggio Calabria and Gioia Tauro, have no SPOs within 5 km of the port.
For PM₂.₅, Antwerpen again stands out with dense coverage, while several other ports lack nearby stations entirely.
Even where SPOs exist, they are often not in the right place relative to the predominant wind.
Based on 2021 analysis, only five ports (Algeciras, Antwerpen, Genova, Marseille and Napoli) had at least one NO₂ station located downwind of the port more than 25% of the time.
In many cases, total wind frequency coverage for port-proximate stations was below 50%, meaning that for most hours of the year, the direct influence of port emissions is not being measured.
When the wind does blow from the port towards the monitors, the effect is clear.
Under downwind conditions, NO₂ concentrations increased by over 100% in Napoli and by 75–86% in Hamburg, Algeciras and Antwerpen, compared with other wind directions.
While these increases also reflect wider urban emissions, they are consistent with ports acting as local NO₂ hotspots.
Air quality maps fill some of the gaps. In 2023, annual average NO₂ concentrations were higher inside all studied ports than in their surrounding regions.
In roughly half of the ports, NO₂ levels were more than double those in the surrounding areas; in Algeciras, they were four times higher. Piraeus and Napoli exceeded the revised 20 µg/m³ annual limit for NO₂ that must be met by 2030, and Marseille sat just below it.
For PM₂.₅, patterns are more complex. Concentrations are generally higher in port areas than their surroundings, but the differences are smaller and confounded by other regional sources.
Even so, 13 of the 22 ports had PM₂.₅ levels above the new 10 µg/m³ annual limit, with several surrounding regions also above that value. This points to a combined port–city contribution that will be difficult to untangle without more targeted monitoring.
A similar analysis was carried out for 23 airports across 17 countries.
All have at least one NO₂ monitoring station within 10 km, but only a minority have stations within or immediately adjacent to the airport perimeter, and wind coverage is often poor.
As with ports, wind-direction analysis reveals strong NO₂ increases when air parcels pass over the airport before reaching the monitor.
At Amsterdam, mean NO₂ concentrations at a nearby station rose by 113% when the wind came from the airport compared with other directions.
Rome, Lisbon and Madrid all showed increases of around 80–90% under airport-downwind conditions.
Using air quality maps, annual mean NO₂ concentrations in 2023 were higher inside nearly all airports than in surrounding regions, with Lisbon and Madrid showing differences of more than 10 µg/m³. Milan Linate exceeded the revised 20 µg/m³ annual limit.
PM₂.₅ differences were smaller but still present at many sites, and six airports recorded PM₂.₅ levels above the new 10 µg/m³ limit.
The report goes further for airports by examining ultrafine particles.
Several major hubs, including Amsterdam, Berlin, Brussels, Copenhagen, Frankfurt, Helsinki, Paris, Vienna and Zurich, have measured UFPs using particle number concentration (PNC) metrics.
Despite differences in measurement protocols, a common pattern emerges.
Within or close to the airport (within about 1 km), average PNC often exceeds 20,000 particles/cm³ over 24 hours, with annual averages as high as 27,000 particles/cm³ at some downwind sites. At distances of 5–10 km, PNC typically falls below 10,000 particles/cm³.
These steep gradients, coupled with evidence that UFPs can penetrate deep into the lungs and potentially enter the bloodstream, explain why UFPs have been recognised by WHO as a pollutant of emerging concern.
The revised Directive now mandates UFP measurement at locations where high concentrations are expected and at designated supersites, creating a new monitoring requirement that airports are likely to sit at the centre of.
For environmental monitoring professionals, the briefing highlights several priorities.
First, network design and siting are now clearly regulatory issues.
To characterise ports and airports as hotspots, sampling points must be positioned with respect to prevailing wind directions, emission source locations and nearby residential areas, not just administrative boundaries.
Wind sector analysis and probabilistic exposure modelling become essential tools, rather than optional extras.
Second, combining fixed-site data with high-resolution air quality maps is likely to become standard practice.
The EEA’s 1 km maps, which fuse model outputs with observations and land-cover data, are already being used to fill monitoring gaps and benchmark hotspot areas.
This creates demand for consistent, high-quality input data from ground-based instruments and may drive interest in co-located sensors and remote sensing.
Third, the inclusion of UFPs in the Directive’s monitoring requirements will push networks towards instruments capable of measuring particle number concentrations and size distributions, not just mass.

Airports are an obvious focus, but ports and nearby industrial areas may follow as evidence accumulates.
Finally, the report underlines that ports and airports are not isolated from their urban context.
Many surrounding regions already sit close to or above the revised 2030 limits for NO₂ and PM₂.₅.
As air quality roadmaps are developed, authorities will need monitoring data that can attribute contributions to different sources with enough confidence to support targeted measures, whether that means shore power in ports, cleaner fuels and abatement on ships and aircraft, traffic management, or localised zoning and land-use changes.
The EEA’s conclusion is straightforward: ports and airports are substantial and, in many cases, under-monitored sources of air pollution.
As Europe moves towards stricter standards by 2030, building monitoring networks that accurately capture their impact will be a prerequisite for effective regulation and health protection.
IET 36.5 Sept/Oct 2026


 Product directory




.jpg)












.jpg)









.jpg)