Air monitoring
Published over 3 years ago. See the latest and most current information on Air monitoring.
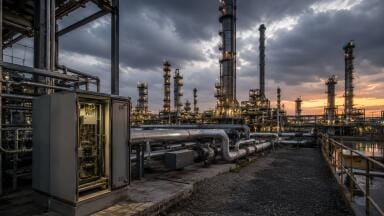
To limit global warming to 1.5°C, an immediate transition away from coal and oil is required but doing so will be difficult given the amount of energy needed. Currently, natural gas is employed as a bridging fuel. It produces the same amount of energy as coal and oil but emits less CO2. Methane (CH4), a gas released by natural gas, has a greater warming effect than carbon dioxide (CO2). As potential gas replacements with lower CO2 and CH4 emissions, biomethane and biogas have gained popularity. However, these replacement fuels are not CH4 emission free. Indeed, previous studies[2-5] show that CH4 is released at various points during production and distribution, but we still don’t fully understand where, when, and how much CH4 is released.
According to the International Energy Agency[6], global biomethane and biogas production could meet nearly 20% of global gas demand if its sustainable potential was fully realised, and 35 million tonnes of oil equivalent biogas and biomethane were used globally in 2018. As the graph shows, the majority of the production comes from Europe. However, recent studies [2, 5] show that biomethane and biogas production facilities can also emit methane. These studies have measured on-site (measurement of emissions at each individual point source) and off-site (measurement of emissions based on observations made away from the site). However, a comprehensive evaluation by characterising the distribution of CH4 emissions at each biomethane & biogas supply chain stage remains unclear.
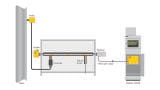
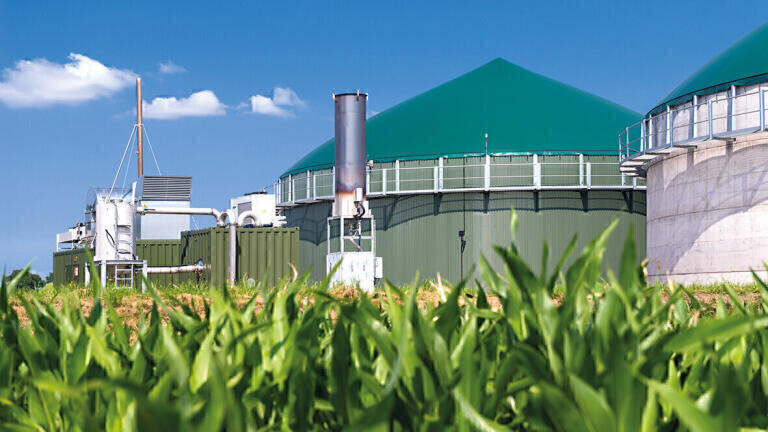
In this study, datasets for each emissions source were divided into 5 subcategories seen as Figure. The stages in the biomethane supply chain are: (i) Feedstock including collecting and storing organic materials (Feedstock), (ii) biogas production stage where the feedstock is converted to biogas under anaerobic conditions (AD), and possible point sources are AD, buffer thank and hyginisation tank (iii) the third stage is the biogas upgrading. Different biogas upgrading methods can be used to generate biomethane such as PSA, water scrubber, chemical scrubber, chemical absorption and membrane, (iv) Transmission, storage and distribution, and (v) digestate stage with open and closed digestate storage.
Here we bring together the published emissions data from 51 various CH4 measurement studies, to assess and synthesise the distribution of emissions from each supply chain stage to characterise the emissions profile of the biomethane & biogas supply chain. First, we compiled from several published studies, and obtained the data from on-site (taken at each individual emission source) and off-site measurements (reported for the entire site). The existing literature reports emission rates in different units, and some studies provide insufficient information to allow for unit conversion. In this study, CH4 emission estimates were converted into percentage of total production (volume of CH4 emitted/volume of produced gas) and grams of CO2 -equivalent per megajoule of energy based on higher heating value (HHV). We assume GWP of 100 years as 27.2 based on IPCC AR6 report[7], and higher heating value as 38.1 MJ per m3. The dataset obtained from the literature exclude methane emissions from the landfill and wastewater treatment plants without anaerobic digesters.
After classifying the data collected from mobile on-site measurements, we need to determine the probability density function (PDF) of emissions in each stage. The PDF establishes a good fit of the emissions for each stage, including an uncertainty assessment. The emissions in each stage have distinct characteristics, particularly in terms of the various high emitters, their data and probability distributions. Due to the heavy-tailed distribution and small sample size, the nonparametric probability density function, kernel density estimations (KDE), were used to investigate the PFDs of the emissions from each stage using Python before summing up each stage. The total emissions from the supply chain were estimated using Monte Carlo simulations with 10,000 random draws.
On these figures, each curve defines the cumulative distribution for a single Monte Carlo simulation and shows that total supply chain emissions range from 2.5 to 343 g CO2 eq./MJHHV. Median emission is around 41 g CO2 eq./MJHHV at 95 confidence intervals (CI). And mean emissions are eq./MJHHV. As you see in the figure and the mean emissions are higher than median, the biomethane supply chain emissions distribution is highly upward-skewed which is indicative of disproportionately high emitting sites referred to as “super-emitters”. Also 5th percentile emission is around 15 g CO2 -eq./MJHHV (at the 95% CI) and a 95th percentile emission ranges between 131 and 133 (at the 95% CI) g CO2 -eq./MJHHV using GWP100 values.
Using global biogas and biomethane production of 35 Mtoe (1.47´1012 MJ)[6] in 2018, biomethane& biogas supply chain can emit 6.4–7.8 Tg CH4 yr-1 at the 95th percentile, an average of 2.8–2.9 Tg CH4 yr-1.
When we look at the Figure B for the cumulative distribution of emissions as a percentage of total CH4 produced. The 5th percentile is around 2.0 (at the 95% CI) % of biomethane production, and the 95th percentile is around 12.6 – 12.8 (at the 95% CI) % of total gas production. The range in minimum, median, mean and maximum values were fairly consistent across all estimates. While the low and median estimates are nearly identical, the disparity between biomethane and natural gas varies widely in the highest estimates. The median ranged from 5.1 to 5.3 (5.1 – 5.2 at the 95% CI)%, with mean emission rates of 5.90–6.04 (5.9 – 6.0 at the 95% CI) % of total CH4 production, which is higher than natural gas (0.8 to 2.2% of CH4 production[8, 9]). We can see that the production –normalised emission rate is considerably higher than oil and gas. This could be due to a variety of factors, including poorly managed production facilities, a lack of attention to the biomethane industry resulting in lower investments for modernisation, operation, and monitoring, as well as employment of highly skilled plant operators when compared to oil and natural gas. In addition, poor design and management of feedstock and digestate storage units, as well as a limited interest in infrastructure emissions may result in higher emission rates compared to the amount of gas produced. Because oil and natural gas supply chains have been primarily operated by large companies for decades, they have invested more in leak detection and repair.
As stated before, the cumulative distribution figure exhibits the heavy-tailed distribution. A small number of high emitters may cause under- or overestimations of emissions rate if they have intermittent emissions patterns, insufficient process equipment usage or inadequate operations and maintenance strategies. In this study, super-emitters have been investigated at various stages across the supply chain, including feeding systems, substrate storage, run-off ponds, pressure relief valves on the anaerobic digesters and gas holders, exhausts and aeration lines of upgrading units, ventilation of units such as compressors or closed digestate tanks, open digestate storage and flaring. Since we lack information on on-site CH4 sources, we identify them the highest 5% of total emissions (199–224.8 g CO2 -eq/MJHHV) account for 62% (CI: 58–66%) of cumulative emissions, which is similar to oil and natural gas supply chain distribution[10, 11].
Emissions are mainly from digestate storage, followed by production and upgrading stages. Similar results were observed by Reinelt et al. (2017) where the highest emissions are from open digestate storage and pressure release valves[12]. Similarly, Alvarez et al.[13] found production and gathering units to be the main emission source in the US oil and natural gas supply chain. Overall, the lowest emissions are exhibited in the transmission, storage and distribution (TSD) stage similar to the US oil and natural gas supply chain25.
To sum up, this study shows that biomethane and biogas supply chain methane emission rate can exceed those in oil and natural gas. We identified the super emitters as the highest 5% of emitters account for 62% of cumulative emissions. We would like to highlight that those emissions can be avoided if necessary measurements are taken. Given the growth in biomethane generation due to national decarbonisation strategies, more urgent efforts are also needed for the biomethane supply chain to address not only CH4 emissions, but also the sustainability of biomethane.
This article was adapted from the study by Bakkaloglu et al. 2022[1]. The study’s specifics can be found here.
1. Bakkaloglu, S., J. Cooper, and A. Hawkes, Methane emissions along biomethane and biogas supply chains are underestimated. One Earth, 2022. 5(6): p. 724-736.
2. Bakkaloglu, S., et al., Quantification of methane emissions from UK biogas plants. Waste Management, 2021. 124: p. 82-93.
3. Kvist, T. and N. Aryal, Methane loss from commercially operating biogas upgrading plants. Waste Management, 2019. 87: p. 295-300.
4. Tauber, J., et al., Quantifying methane emissions from anaerobic digesters. Water Science and Technology, 2019. 80(9): p. 1654-1661.
5. Scheutz, C. and A.M. Fredenslund, Total methane emission rates and losses from 23 biogas plants. Waste Management, 2019. 97: p. 38-46.
6. IEA, Outlook for biogas and biomethane: Prospects for organic growth. 2020.
7. IPCC, Climate Change 2022: Mitigation of Climate Change. Contribution of Working Group III to the Sixth Assessment Report of the Intergovernmental Panel on Climate Change, J.S. P.R. Shukla, R. Slade, A. Al Khourdajie, R. van Diemen, D. McCollum, M. Pathak, S. Some, P. Vyas, R. Fradera, M. Belkacemi, A. Hasija, G. Lisboa, S. Luz, J. Malley, (eds.), Editor. 2022.
8. Balcombe, P., et al., Methane and CO 2 emissions from the natural gas supply chain. Sustain. Gas. Inst, 2015.
9. Balcombe, P., N. Brandon, and A. Hawkes, Characterising the distribution of methane and carbon dioxide emissions from the natural gas supply chain. Journal of Cleaner Production, 2018. 172: p. 2019-2032.
10. Omara, M., et al., Methane emissions from natural gas production sites in the United States: Data synthesis and national estimate. Environmental science & technology, 2018. 52(21): p. 12915-12925.
11. Zavala-Araiza, D., et al., Super-emitters in natural gas infrastructure are caused by abnormal process conditions. Nature communications, 2017. 8(1): p. 1-10.
12. Reinelt, T., et al., Comparative use of different emission measurement approaches to determine methane emissions from a biogas plant. Waste management, 2017. 68: p. 173-185.
13. Alvarez, R.A., et al., Assessment of methane emissions from the US oil and gas supply chain. Science, 2018. 361(6398): p. 186-188.
IET 36.3 May