Ambient air quality
Published over 2 years ago. See the latest and most current information on Ambient air quality.
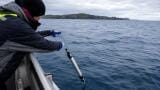
In most countries, mobile network operators (MNOs) deploy tens of thousands of base stations to deliver mobile communications services to their customers. It is estimated that there are approximately 7 million base stations worldwide [1]. These deployments positively correlate with population density and base stations come in many different types from large rural masts, approx. 20-25 metres high, to street works locations which are typically around 10-15 metres high, to rooftop sites, whose height depend on the height of the building that hosts the equipment.
In addition to providing wireless connectivity to subscribers, a mobile communications network (MCN) can also become a powerful environmental sensor thanks to the following key characteristics: 1) its pervasive infrastructure can be used as real estate for hosting a wide range of sensors in a cost-effective manner (weather, air quality, noise, etc.) 2) its ability to capture subscriber mobility patterns in aggregated and anonymised form in compliance with General Data Protection Regulation (GDPR) 3) its intrinsic ability to detect humidity and rain at certain frequencies, given the physical properties of the wireless channel.
By strategically leveraging these benefits, an MNO can deliver a high-resolution and real-time environmental data set that can enrich and add resolution to existing sources of data and be used for a wide variety of use cases, for example: to increase accuracy and resolution of weather forecasting and nowcasting models, to calculate accurate risk factors for wildfire and floods and understand their impact on communities as they occur, to build high-resolution air quality (AQ) maps that can inform policy makers on the most effective pollution mitigation strategies.
We refer to this concept as “Network as a Sensor”.
Vodafone is already unlocking the power of its mobility patterns through its Vodafone Analytics practice [2] and, together with Vantage Towers and its ecosystem of partners, is running several pilots across Europe to prove how telecommunications infrastructure can deliver high-resolution and real-time data assets on weather [3].
This paper focusses on a pilot on AQ in the UK, where Vodafone is working in partnership with Vantage Towers, Cornerstone, Wireless DNA, Scotswolds, Cambridge University, and Cambridge Environmental Research Consultants (CERC). The pilot is live in the city of Glasgow, where a network of AQ sensors is being deployed on a selection of base stations in the city centre to monitor AQ at high resolution in space and time. The data derived from the sensors can be used in harmony with mathematical modelling to build high-resolution AQ maps and accurate forecasts and identify local sources of air pollution versus the regional background.
Initial findings suggest that:
While this article is being written, the project is entering its second phase of execution, with the key objective of assimilating sensor data into CERC’s Atmospheric Dispersion Modelling System (ADMS-Urban) [4, 5, 6] in order to constrain emission inventories which can then provide key information for policy decisions on the local and regional scale, and which can produce high spatial resolution maps for public dissemination, including AQ forecasts.
As conventional monitoring networks often lack spatial granularity and are typically sparse and fragmented across countries, an MCN can overcome these limitations by enabling measurements of AQ at high granularity in space and time and provide broad spatial coverage with a consistent performance across country borders. Moreover, the presence of an MCN correlates with population density, which makes its spatial distribution ideal for better understanding the impacts of pollution hot spots on communities.
The data generated by such a network has the potential to be transformative as it can truly drive strategic change and mitigation actions.
This high spatial and temporal resolution data can in fact empower stakeholders to achieve the following, at scale:
Scotland has some of the most stringent AQ standards to be found anywhere in the world and has recently introduced a wide range of measures under Clean Air for Scotland 2 (CAFS2) aimed at further improving AQ across the country.
Glasgow is the first Scottish city to implement a Low Emission Zone (LEZ) restricting vehicles older than Euro 4 as from June 1st 2023 and imposing fines for non-compliant vehicles. This project coincides with the introduction of the LEZ and has the potential to contribute to the understanding of how the LEZ can improve AQ in the city centre over this period. All other major Scottish cities are also implementing LEZ’s during 2024.
The AQ pilot in Glasgow, Scotland, is organised into two key phases:
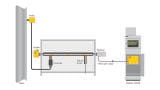
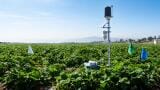
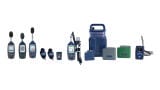
Phase 1 (June 2022 – Present): This first phase is designed to test a range of different AQ sensor systems from a number of manufacturers attached to a major cellular transmitter in a central location in the city of Glasgow. At this location, the large array of AQ sensors is exposed to well mixed air volumes allowing direct comparisons of sensor performance during Phase 1, as shown in Figure 2. The sensors are measuring NO, NO2, O3, CO2, PM10, PM2.5 at 1-minute intervals. Reference AQ data is available from a nearby conventional monitoring station operated by the city and this is enhanced by an additional reference-grade CO2 instrument made available to the project by Cambridge University. Data is collected via the manufacturer’s online user interfaces and API services by Wireless DNA and made available for analysis by our partners from Cambridge University. A schematic of the end-to-end architecture is illustrated in Figure 3.
Outcome of Phase 1
Initial results show that proximity to a transmission tower has no discernible effect on the data quality (Figure 4). The out-of-box measurements form the sensor systems broadly track the nearby reference observations from Glasgow Townhead station (Pearson’s coefficient r>0.8 except for the CO2 and one of the PM2.5 of Platform 2) and the unique diurnal patterns in the cellular transmission data are not observed in any of the sensor readings. Some candidates performed better than others and as a result those were chosen to feature in Phase 2 of the project.
Phase 2 (June 2023 – Dec 2023): The second phase of the project has the objective of deploying a small network of devices across Glasgow and across a chosen city in Spain, whilst still operating the Phase 1 site as an additional node within the network and as a facility allowing the sensor manufacturers to provide updated test equipment for emerging sensing technologies. Figure 5 illustrates the end-to-end system diagram, whereas Figure 6 illustrates the type of high spatial resolution AQ data that Phase 2 will deliver.
The key objectives of Phase 2 are as follows:
The significant advances made in small sensor technology in recent years is such that the capital cost of such devices is significantly lower than that of conventional AQ monitoring systems and they can be deployed in many locations where conventional monitors cannot. However, the operational costs of running a network of sensor systems can still be significant, let alone the task of finding suitable monitoring locations with planning consent, power, communications and security. This is where leveraging an existing network infrastructure such as a cellular network can enable easy and sustainable deployment and reduce operational costs.
Phase 1 of the AQ pilot in Glasgow has demonstrated that mobile networks are suitable for hosting AQ sensors and that, thanks to their pervasive infrastructure, they are well positioned to cost-effectively scale hyper-local AQ monitoring networks. The next phases of the project will illustrate how such monitoring networks can work in harmony with mathematical models to produce accurate and high-resolution AQ maps, and empower stakeholders to target mitigation and policy interventions, to help improve AQ for all.
The authors would like to thank and acknowledge the following colleagues, whose contributions to the project are key to its success: Jaime Abril and Bhupinder Kaur (Vantage Towers), Nick Spedding and Spiros Dervisis (Cornerstone), Julia de Juan Verger, Helena Antich Homar, Maria Francisca Cardell Martínez (Wireless DNA), Evangelia Chatzidiakou (University of Cambridge), Luis Gonzaga Ridruejo (Vodafone Analytics), David Carruthers and Daniel Connolly (CERC), Dalibor Budimir and Nadir Nawab (Vodafone UK).
[1] GSMA: Blog: How many global base stations are there anyway? - Mobile World Live
[2] Vodafone Analytics
[3] Telco Titans: Vodafone embraces network-based weather forecasting | Partnerships & Alliances | TelcoTitans.com
[4] Owen, B., Edmunds, H.A., Carruthers, D.J. and Singles, R.J., 2000. Prediction of total oxides of nitrogen and nitrogen dioxide concentrations in a large urban area using a new generation urban scale dispersion model with integral chemistry model. Atmospheric Environment, 34(3), pp.397-406
[5] Carruthers D, Stidworthy A, Clarke D, Dicks J, Jones R, Leslie I, Popoola OAM and Seaton M, 2019. Urban emission inventory optimisation using sensor data, an urban AQ model and inversion techniques. International Journal of Environment and Pollution, vol. 66, issue 4, pp. 252-266
[6] https://www.cerc.co.uk/urban
[7] QCumber-EnvHealth Project: CERC > Environmental research > Smart cities
IET 36.3 May