Air quality monitoring
The City of London Corporation’s new Air Quality Strategy 2025–2030 is notable not just for its ambition, but for the central role it gives to monitoring.
With more than ninety per cent of particulate matter imported from beyond the Square Mile and nitrogen dioxide still lingering at roadside, the Corporation is placing modelling and data transparency at the heart of its plan to deliver clean air.
For environmental monitoring professionals, the strategy offers a detailed case study in how long-term air quality management depends on dense, trusted measurement networks.
The Corporation has been measuring air pollution for over sixty years, beginning in the smog-filled 1950s when local smoke bans paved the way for the Clean Air Act.
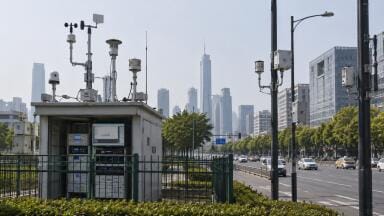
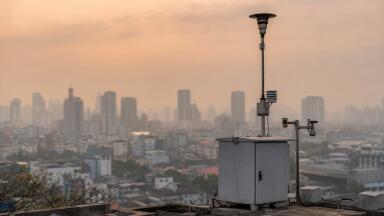
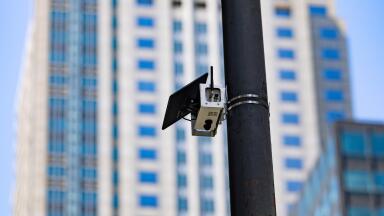
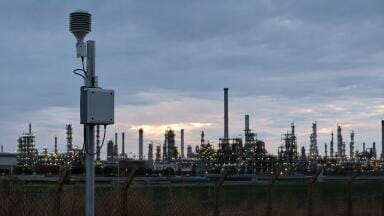
Today, its focus is on fine-grained, multi-pollutant surveillance that balances regulatory-grade precision with broad spatial coverage.
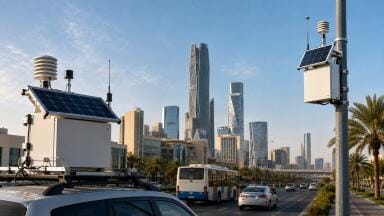
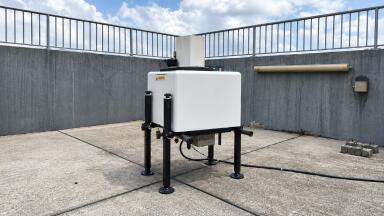
Continuous automatic analysers provide high-resolution data on nitrogen dioxide, particulate matter and ozone, with a commitment to maintain at least five sites that achieve a minimum of ninety per cent data capture across the year.
This is complemented by more than seventy passive diffusion tubes that measure monthly averages of nitrogen dioxide at locations spread across the Square Mile.
Together, these systems capture both the temporal and geographical variation of pollutants.
Locations are reviewed annually, with flexibility to add new sites as conditions change.
Monitoring has already expanded beyond the Square Mile itself.
Instruments now operate at City markets and on bridges as well as in Epping Forest, where nitrogen dioxide and ammonia are measured to assess their impacts on sensitive ecosystems.
The strategy’s monitoring programme does far more than fulfil statutory reporting requirements.
It underpins a set of progressive targets that go well beyond national standards, aligning instead with the 2021 World Health Organisation guidelines.
The Corporation’s goal is that by 2030 more than ninety per cent of the Square Mile records annual mean nitrogen dioxide below thirty microgrammes per cubic metre.
For particulate matter, the aims are fifteen microgrammes for PM₁₀ and ten microgrammes for PM₂.₅, both a full decade ahead of the UK’s national deadlines.
Monitoring provides the evidence base to judge whether these aims are realistic.
In 2023, for example, seventy-four per cent of the Square Mile was already below the thirty microgramme nitrogen dioxide threshold, up from just thirty per cent in 2018.
By publishing annual progress reports, the Corporation makes itself accountable, while also placing pressure on developers and transport providers to demonstrate their contributions to cleaner air.
[[PR;64834:2028-01-01]]
The instrumentation mix reflects a broader shift in urban air quality monitoring.
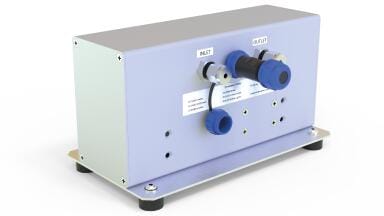
Regulatory-grade reference analysers, using chemiluminescence for nitrogen dioxide and gravimetric or TEOM-based systems for particulates, remain the backbone of compliance monitoring and trend analysis.
Diffusion tubes, though less precise, provide unrivalled spatial coverage at low cost, making them indispensable for mapping community exposure.
More recently, ozone has been added to the City’s portfolio, even though it is not a statutory requirement, reflecting rising concern about secondary pollutants in a warming climate.
Monitoring is also supplemented by dispersion modelling, drawing on the London Atmospheric Emissions Inventory and site-specific simulations.
This allows data gaps to be filled, future scenarios assessed and stubborn pollution hotspots identified with greater accuracy.
One of the most striking aspects of the strategy is its shift in focus from transport emissions to non-transport sources, a change driven by monitoring and source apportionment.
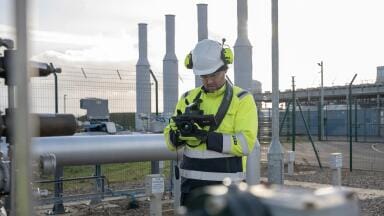
Construction activity is now identified as the largest local source of PM₁₀, making on-site measurement and compliance checks essential.
Commercial cooking has emerged as the biggest contributor to locally generated PM₂.₅, an often-overlooked source that the Corporation now intends to target with further measurement and mitigation.
Backup diesel generators and gas boilers remain significant emitters of nitrogen oxides, leading the Corporation in 2024 to begin cataloguing standby generators across the Square Mile as a precursor to closer monitoring.
This broadening of focus demonstrates how measurement networks must adapt as dominant emission sources change.
Where once roadside nitrogen dioxide was the overwhelming concern, attention is now turning to generators and construction plants.
The Corporation has also made a strong commitment to data transparency and public access.
Live monitoring data is available on its website, while the CityAir smartphone app provides alerts, personalised exposure advice and low-pollution route planning.
These digital tools are supported by the AirText service, which offers SMS and email alerts, as well as school and nursery reports that detail site-specific monitoring results.
Monthly newsletters and annual air quality briefings for health officials reinforce the flow of information.
For monitoring professionals, this emphasis on turning raw data into usable health advice illustrates the growing expectation that networks should serve not just regulators but the public directly.
Given that three quarters of nitrogen oxides and more than ninety per cent of particulates in the City originate outside its boundaries, the Corporation’s monitoring efforts are necessarily collaborative.
Data is shared with the Greater London Authority and Transport for London to integrate with city-wide models; with the Environment Agency to support compliance around combustion plant and generators; and with the Port of London Authority, which undertakes river-side monitoring and has begun retrofitting vessels.
Universities and research groups, through initiatives such as the Air Pollution Research in London network, are also involved, ensuring that local monitoring contributes to national and international understanding of urban air pollution.
What stands out in the strategy is how clearly monitoring is tied to enforcement and policy.
Data is used to assess planning applications, to guide interventions at construction and demolition sites, to support anti-idling enforcement and to inform revisions of the City’s Air Quality Supplementary Planning Document.
The feedback loop is explicit: monitoring informs modelling and modelling shapes intervention.
This loop is what enables the City not only to demonstrate compliance, but to move beyond it and pursue outcomes aligned with WHO guidelines.
By committing to high-quality and transparent, the City ensures that each new emission source can be identified and tracked.
In a globalised city where most pollution drifts in from elsewhere, local monitoring still matters.
Not only does it protect residents and workers, it also enables a small jurisdiction to influence broader regional and national decisions.
As the Square Mile moves towards 2030, its monitors, from roadside analysers to ammonia samplers in Epping Forest, will be as decisive in shaping air quality improvements as any transport policy or development regulation.
The story of London’s next clean air gains will be written in the data streams of its instruments.
IET Guide 2026

 Product directory