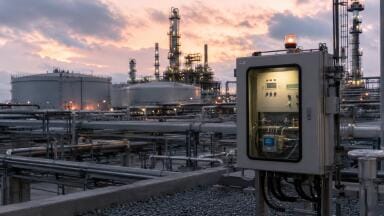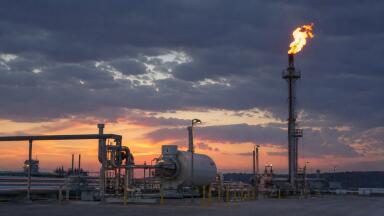
Industrial emissions
Its core finding is simple but important: emissions are not evenly distributed.
A small fraction of facilities accounts for a disproportionate share of the sector’s footprint, and key emission sources sit inside specific functional zones rather than being spread evenly across whole plants.
For environmental monitoring professionals, the significance is not just the headline estimate of 163.6 million tonnes of CO2 in 2022. It is the resolution. This is a move away from broad assumptions and towards plant-level visibility.
Traditional carbon accounting in heavy industry has usually relied on sector-wide averages, fuel-based calculations and national inventories. These approaches can be useful for top-level reporting but they are much less effective when the aim is to decide where interventions should happen first.
What this study shows is that the pulp and paper sector is highly uneven. Roughly 5% of the highest-emitting plants account for about 43% of the sector’s total emissions. That alone suggests that treating the industry as a uniform block is no longer good enough. It also means that a flat regulatory approach may miss the biggest opportunities for rapid emissions cuts.
For monitoring professionals, that matters because it changes what “good data” looks like. It is no longer enough to know the average intensity of a sector or province. Increasingly, regulators, operators and investors will want to know which individual facilities matter most, why they matter, and what can be done about them.
One of the most useful aspects of the study is that it does not stop at the plant boundary. Using remote sensing, the researchers identified functional zones within sites, including raw material storage, thermal power areas, wastewater treatment and other built-up spaces. That turns the plant into something spatially analysable rather than a single reporting unit.
This is important because it begins to connect carbon accounting with the day-to-day realities of industrial monitoring. It suggests that emissions can be associated with specific site functions and process areas, not just with total energy consumption. In particular, the study found that wastewater treatment areas were a consistent emissions driver across plant types. That is striking because wastewater is often treated as a compliance issue in its own right, rather than as a major part of the carbon picture.
The wider implication is that carbon monitoring is beginning to converge with process and environmental monitoring. If emissions are concentrated in certain zones or systems, then better monitoring of those zones becomes central to decarbonisation. That could mean stronger demand for integrated sensing around utilities, treatment processes, energy use and plant infrastructure, as well as better data platforms to bring those streams together.
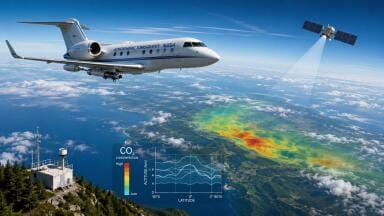
The framework also matters because of how it works. Rather than relying on a single data source, it combines satellite imagery, industrial text data and numerical modelling. The researchers used imagery to define plant boundaries and distinguish some facility types, while a BERT-based text classification model helped separate others that could not be identified by imagery alone.
That is significant because it points to the future shape of industrial monitoring. Increasingly, the challenge is not only measuring something accurately, but combining different kinds of information into one usable system. Instrument data, site documents, production descriptions, geospatial observations and modelled estimates are all starting to sit within the same analytical environment.
In that sense, AI is not just being used here as an optimisation tool. It is acting as a data integration layer. For monitoring professionals, that is a useful signal. Future monitoring platforms may need to handle not just sensor outputs, but also unstructured plant information, geospatial evidence and automated classification. The value will come from linking them.
The study’s rooftop solar modelling adds another practical dimension. It suggests that, under favourable conditions, annual emissions could be reduced by up to 16.9 million tonnes of CO2, or around 10.3% of sector-wide emissions. The important point, though, is less the exact number than the method behind it. The researchers are not talking about decarbonisation at the level of the whole sector in the abstract; they are identifying where plant-specific mitigation might work best.
That makes this kind of accounting much more actionable. Instead of broad decarbonisation targets being spread thinly across an industry, interventions can be matched to sites with the highest leverage. In practice, that could support more efficient retrofit decisions, better prioritisation of solar investment and a stronger case for tailored regulation rather than one-size-fits-all requirements.
For the monitoring sector, this makes measurement more central to capital allocation. Monitoring is not just there to confirm compliance after the fact. It becomes part of deciding where money should go, which upgrades are most likely to pay off, and how reductions should be verified.
There is also a broader regulatory implication. If plant-level emissions can be estimated with strong model performance, then regulators may gain a much more detailed external view of industrial carbon footprints. That opens up the possibility of checking reported emissions against independently derived spatial estimates and of identifying high-emission sites without relying entirely on operator disclosure.
This fits a wider trend already visible in other areas of environmental oversight, including methane detection, land-use monitoring and remote observation of pollution events. Satellite-based and AI-assisted methods are gradually reducing the gap between what happens on site and what regulators can see.
For industry, that means less room for averages, assumptions and generic reporting categories. For monitoring providers and instrumentation users, it means greater pressure to produce data that is traceable, transparent and consistent with a more data-rich compliance environment.
Although this study focuses on China’s pulp and paper sector, the wider implications extend much further. Many industrial sectors still rely on coarse emissions accounting despite being highly heterogeneous at plant level. Cement, steel, petrochemicals and waste infrastructure all have similar problems: complex sites, mixed processes and large variations between nominally similar facilities.
That is why this work matters beyond its immediate case study. It offers a blueprint for combining remote sensing, AI and industrial context data to create plant-level carbon intelligence in sectors where average-based accounting has hidden the most important variation.
For monitoring professionals, the wider message is clear. The next stage of industrial carbon accounting will be more spatial, more integrated and more selective. The question will not simply be how much a sector emits, but where, why and through which systems. That is a much more monitoring-intensive future, and one that places environmental data much closer to the centre of industrial strategy.
IET 36.3 May