Ambient air quality
The episode is a case study in why regulators and monitoring professionals need to think in hours, not years.
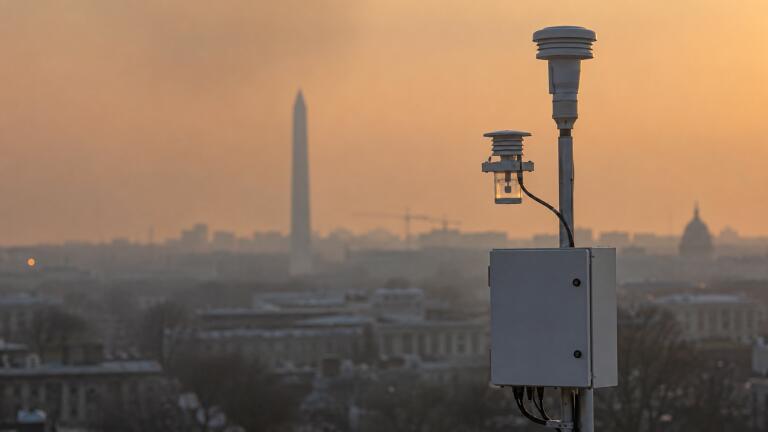
On 4 July 2026, a 40-minute fireworks display above the National Mall in Washington DC produced one of the sharpest short-term air pollution spikes the US capital has recorded.
The show was part of “Freedom 250”, an event marking the 250th anniversary of American independence.
Organisers said around 850,000 fireworks shells were launched from ten sites, including the Lincoln Memorial Reflecting Pool, barges on the Potomac River and West Potomac Park.
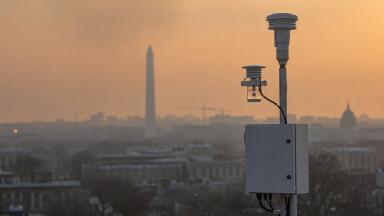
Within hours, hourly PM2.5 concentrations peaked at 6.7 times pre-fireworks levels, according to a report by Clarity Movement, whose sensor network is operated in partnership with the DC Department of Energy and Environment.
DC officials issued a Code Red air quality alert. The city briefly ranked among the most polluted locations tracked by IQAir, the Swiss air quality technology company. By the following morning, conditions had returned to normal.

The display was enormous by any historical measure. The National Park Service said the 2026 show used around 850,000 fireworks, against roughly 7,000 the previous year, a more than hundredfold increase.
Organisers had targeted a Guinness World Record, aiming to beat the 810,904 shells set off during a 2016 New Year celebration in the Philippines. As of initial reporting, Guinness had not publicly confirmed a new record.
Conditions were already poor before the fireworks began. DC endured a triple-digit temperature on 4 July, with heat index values reaching 105 to 109 degrees Fahrenheit and a heat advisory in place into the following evening.
Internal National Park Service documents, reviewed by The Washington Post before the event, reportedly anticipated hazardous fine particulate levels around the Mall and recommended N95 masks for anyone watching outdoors.
Russell Dickerson, an atmospheric scientist at the University of Maryland, later said conditions could have been worse: “We dodged a bullet. It was very bad, but it could have been substantially worse. It was quite unsafe for everybody to be outside.”
Reporting on the alert level has been inconsistent. CNN, The Hill and WTOP said DC’s official alert, issued through the AlertDC system, was Code Red, corresponding to the EPA’s “Unhealthy” category.
Forbes and some other outlets described the event as “Code Purple”, corresponding to “Very Unhealthy” conditions.
Both descriptions have a basis in the underlying data, and the discrepancy reflects genuine complexity rather than straightforward error.
The blanket regional alert issued for 4 to 5 July, activated through the Metropolitan Washington Council of Governments (MWCOG) forecast programme and DC’s own emergency alert channel, was Code Red.
However, MWCOG’s advance forecast had anticipated a Code Purple designation for DC and Northern Virginia given the scale of the display, and National Park Service documents separately anticipated “very unhealthy” conditions in central DC.
Individual monitors also recorded readings within the Purple range: AirNow data cited by Forbes showed the King Greenleaf Recreation Center site, near the Mall, peaking at an air quality index of 288 around 5am, which sits in the Very Unhealthy band.
For a professional audience, the more useful point is not which label was correct, but that the two labels can both be true at once, depending on averaging period, location and which forecast or measurement is being cited.
That ambiguity has direct implications for public communication during fast-moving events.
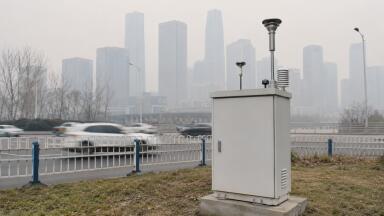
Clarity Movement’s analysis, based on 26 sensors across the district, found the network-average EPA NowCast reading reached the “Unhealthy” category, and that every sensor recorded at least “Unhealthy for Sensitive Groups” conditions during the event.
Pollution stayed elevated for approximately five hours after the peak, which Clarity’s data placed at around 4am on 5 July, before falling back into the Moderate range by around 9am.
Particulate magnesium, a chemical marker associated with fireworks combustion, rose by around 9,600% over pre-fireworks levels, according to the same report.
Notably, impacts were not confined to the immediate launch area.
Clarity found air quality degraded across neighbourhoods some distance from the National Mall, with pollution levels varying by more than a factor of five depending on location, evidence that smoke plumes dispersed unevenly across the city rather than staying near the source.
On IQAir’s platform, DC’s position varied sharply through the day.
Reporting around midday on 5 July placed DC sixth in IQAir’s global ranking, behind Lahore in Pakistan, Kinshasa in the Democratic Republic of the Congo, then Jakarta, Jerusalem and Tel Aviv, in that order. CNN separately reported that DC briefly topped IQAir’s ranking of major world cities before slipping to 26th place by 5:30pm.
The apparent contradiction reflects the fact that IQAir publishes more than one live ranking, and rapidly changing rankings during a short pollution event should be read with that caveat in mind.
This event offers several lessons for those who design, deploy or regulate air quality monitoring networks.
First, density mattered. Clarity’s ability to show neighbourhood-level variation, rather than a single city-wide average, came from having 26 sensors distributed across DC.
A sparser network would likely have understated both the peak and its spread.
Second, chemical fingerprinting added value beyond PM2.5 mass alone.
The magnesium spike gave regulators independent confirmation that fireworks, rather than another source, drove the event, information that matters for source apportionment and for defending regulatory decisions.
Third, alert terminology needs harmonising across agencies.
The Code Red and Code Purple confusion, however explicable, illustrates how forecast-based, location-specific and network-average designations can produce conflicting public messages from a single event, even where the underlying data are consistent.
Fourth, this was a planned, permitted event with known timing and location, unlike a wildfire or industrial accident.
That predictability creates an opportunity for vendors and agencies to pre-position portable monitors, agree data-sharing protocols in advance and test rapid public alerting before rather than during the next comparable event.

Annual and even 24-hour average air quality standards were not designed to capture a pollution event of this kind.
The US National Ambient Air Quality Standards, like most national frameworks, are built around long-term averages precisely because chronic exposure drives most measured health burden.
A spike lasting a few hours, however extreme, may barely register against an annual mean, even where individual sensors briefly exceed hazardous thresholds.
Clarity’s data show the practical distance between “unhealthy for a few hours” and “compliant on an annual basis” can be considerable.
For regulators, equipment suppliers and monitoring professionals, DC’s fireworks spike is a reminder that permitted, foreseeable, short-duration events, from major fireworks displays to industrial flaring or large sporting occasions, deserve monitoring frameworks built around event-based detection and public communication, not solely long-term compliance metrics.
IET 36.5 Sept/Oct 2026


 Product directory












.jpg)