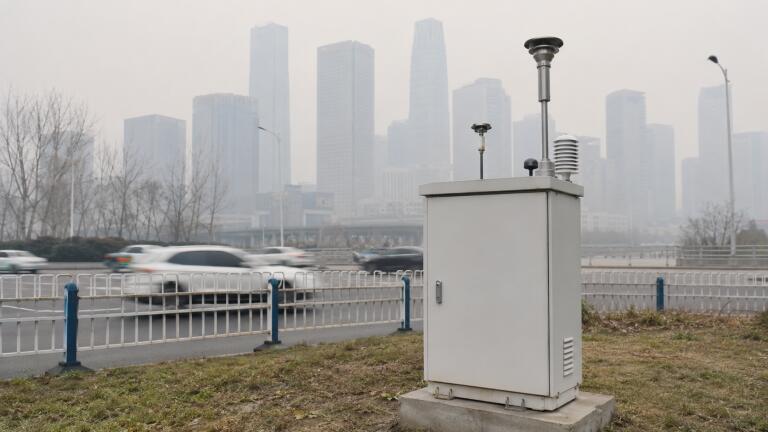
Air quality monitoring
The updated figures, published as part of WHO’s monitoring of the UN Sustainable Development Goals, show that global levels of fine particulate matter, or PM2.5, declined up to 2020 but have since remained largely unchanged.
The findings point to continuing disparities between high-income countries and low- and middle-income countries, where exposure risks remain substantially higher.
For monitoring professionals, the significance lies not only in the air pollution figures themselves, but in how they were produced.
The WHO update draws on an evidence system that combines satellite observations, atmospheric models, ground-based monitoring data and population datasets.
This approach reflects the growing importance of data integration in air quality assessment, particularly where monitoring networks are uneven, incomplete or difficult to compare across countries.

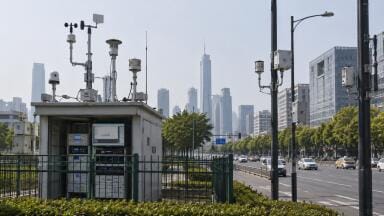
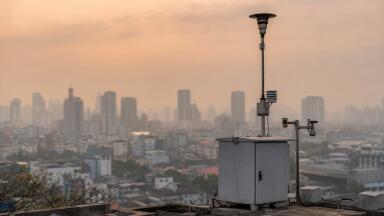
Air quality monitoring has traditionally depended heavily on fixed ground-based monitoring stations.
Those stations remain essential. They provide direct measurements, support regulatory compliance, allow trend analysis and help validate wider modelling systems.
But ground networks alone cannot provide a complete global picture. Monitoring capacity varies significantly between countries, and in some regions direct PM2.5 monitoring remains limited.
This is where integrated systems are becoming increasingly important.
The Data Integration Model for Air Quality, known as DIMAQ, was developed by Dr Matthew Thomas, Lecturer in Data Science & Analytics at The University of Manchester and Research Scientist at the National Centre for Atmospheric Science, in collaboration with WHO.
Since 2016, the model has underpinned WHO estimates of population exposure to ambient air pollution.
DIMAQ brings together satellite observations, atmospheric models and ground-based air quality monitoring data to produce a consistent picture of PM2.5 exposure across countries.
This is especially important for international reporting because the value of the data depends not only on measurement accuracy, but also on comparability.
A country with a dense, mature monitoring network and a country with sparse monitoring coverage cannot be assessed fairly unless the wider evidence system accounts for those differences.
The WHO update contributes directly to several SDG indicators.
These include SDG 11.6.2, which tracks annual levels of PM2.5 in cities, and SDG 3.9.1, which tracks mortality attributed to ambient and household air pollution.
WHO also includes SDG 7.1.2, which tracks access to clean fuels and technologies.
For air quality professionals, this matters because SDG monitoring is not a purely statistical exercise.
The indicators depend on measurement infrastructure, data quality, model calibration, country-level reporting and transparent methodology.
Poor data can weaken policy decisions, obscure local exposure risks and make it harder to assess whether interventions are working.
WHO states that SDG 11.6.2 uses a satellite product combining multiple observations and atmospheric models, recalibrated with national air quality monitoring data from the WHO Air Quality in Cities database and population data from the Global Human Settlement Layer.
In practice, this makes national monitoring networks part of a much larger international evidence chain.
A local PM2.5 monitor may support municipal air quality management, but it can also help improve wider exposure estimates when its data are quality assured, comparable and made available for use in global datasets.
The latest figures show that air pollution progress remains uneven. WHO says PM2.5 levels fell globally until 2020 but have since remained largely unchanged.
n 2023, the number of people exposed to air quality exceeding the least stringent WHO interim target of 35 µg/m³ was thirteen times higher in low- and middle-income countries than in high-income countries, affecting 6.5 billion people.
Regional trends also vary.
Asia continues to bear the highest levels of air pollution, according to WHO, but has also shown the greatest progress.
Other regions, including Africa, Western Asia and Northern Africa, have shown little change over the last decade.
The update also highlights a difference between urban and rural areas.
Urban areas generally experience higher pollution levels than rural areas, but cities have shown stronger improvements regardless of income level.
In contrast, some rural areas in low-income countries have experienced increasing pollution levels.
This creates a monitoring challenge.
Urban air quality networks often receive more investment and policy attention, while rural exposure may be harder to characterise.
For countries where biomass burning, household energy use, dust, agriculture or regional transport contribute significantly to particulate pollution, monitoring strategies need to capture more than roadside and urban background conditions.
The growing role of satellites and models increases the importance of ground monitoring.
Satellite observations can provide broad spatial coverage, while atmospheric models can estimate pollution fields across regions. But both need calibration, validation and uncertainty assessment.
Ground-based monitoring remains the anchor point for these systems.
Without reliable measurements from reference-grade or well-characterised monitoring sites, model outputs become harder to trust and harder to use for policy.
That is particularly relevant as governments move towards more evidence-based air quality plans, climate-health assessments and clean air targets.
Monitoring networks are increasingly expected to do more than demonstrate compliance at a small number of fixed locations.
They are being used to support exposure modelling, health impact assessment, public information systems, local authority planning, emissions reduction strategies and international reporting.
This places pressure on data quality, instrument maintenance, calibration procedures, metadata standards and interoperability.

WHO says reliable data are the foundation for air quality legislation, functional monitoring systems and accountability mechanisms.
The organisation links the updated indicators to its broader goal of reducing mortality linked to air pollution by 50% by 2040.
For the monitoring sector, this is the key point.
Air quality policy increasingly depends on connected evidence systems rather than isolated measurements.
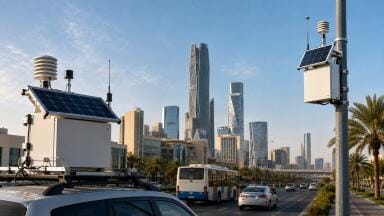
A modern monitoring framework may include regulatory stations, low-cost sensor networks, satellite retrievals, dispersion models, emissions inventories, meteorological data, health datasets and population maps.
The challenge is making those systems work together in a way that is accurate, transparent and useful for decision-making.
That means monitoring professionals are not only collecting data. They are helping to define the evidence base used to judge progress, identify inequalities, prioritise interventions and assess whether policy is reducing exposure.
The WHO update is therefore not just another reminder that air pollution remains a major public health issue.
It is a reminder that clean air policy depends on monitoring systems capable of showing where pollution is falling, where progress has stalled and where populations remain exposed.
IET 36.5 Sept/Oct 2026



 Product directory



















.jpg)