Soil testing
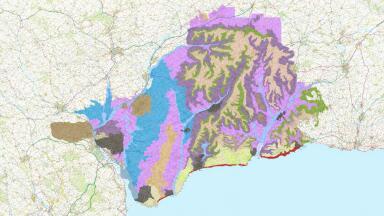
For environmental monitoring professionals and soil analysts, the recent release of the England Peat Map by Natural England represents a game-changing advancement in the assessment, management, and restoration of peatlands.
Developed through the Natural Capital and Ecosystem Assessment (NCEA) programme and launched in May 2025, this interactive, open-access mapping tool offers the most comprehensive national dataset to date on the extent, depth, condition, and vegetation cover of England’s peat and peaty soils.
This high-resolution resource, built on over 300,000 field survey data points and enhanced with AI-driven analysis, LiDAR data, and satellite imagery, empowers professionals across sectors, from conservation and land management to water and emissions monitoring, to make precise, informed decisions about this critical carbon-rich landscape.
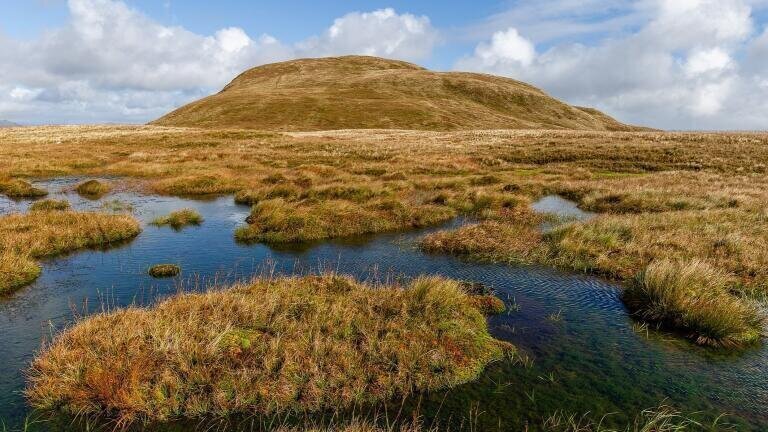
Peatlands cover only around 8.5% of England’s land area, but they punch far above their weight in ecological importance. They are:
However, the new map reveals that nearly 80% of England’s peatlands are degraded, covered with vegetation more typical of drier soils, such as heather and grassland – or even bare, compacted peat.
Only 1% of mapped areas support Sphagnum mosses, the wetland vegetation crucial for natural peat formation.
This detailed landscape-scale view is essential for monitoring practitioners and policy makers seeking to assess GHG emissions, track soil quality, understand vegetation dynamics, and model hydrological risk.
The England Peat Map offers downloadable GIS layers that depict:
These data are especially useful for instrument users conducting ground-truthing, validating remote sensing outputs, or deploying in situ sensors for water quality, soil moisture, or GHG fluxes.
Using machine learning and deep learning, the map achieves:
The map’s national coverage is particularly valuable for projects requiring baseline data for long-term trend analysis, spatial comparisons, or impact assessments linked to agriculture, forestry, or infrastructure.
For regulators, landowners, and catchment management teams, the map can inform:
It also supports DEFRA’s broader policy goals, including freshwater improvement, nature recovery, and emissions reduction.
The degradation of lowland peat soils under intensive agriculture represents a specific challenge.
These areas contribute the lion’s share of England’s peatland-derived GHG emissions. Yet they are also among the hardest to map due to centuries of cultivation and drainage.
The England Peat Map makes substantial progress in these zones but also highlights the need for enhanced site-level monitoring.
Professionals deploying soil probes, gas flux chambers, or conductivity and compaction meters now have a robust spatial framework for prioritising where to monitor, what baselines to use, and how to link their data with regional land-use patterns.
Instruments used for soil nutrient testing, especially in carbon farming or regenerative agriculture initiatives, will benefit from this new ability to align field data with accurate peatland maps and degradation indicators.
The dataset and technical documentation are available via:
For users in instrumentation-heavy roles, the User Guide and metadata layers include guidance on confidence intervals and how best to combine the map with ground-based measurements.
Whether validating carbon sequestration claims or informing flood resilience schemes, this tool offers a robust backbone for evidence-based environmental management.
As restoration funding scales up, including a £400 million allocation for nature recovery, the Peat Map will serve as a critical resource for ensuring this investment targets the most degraded sites with the greatest potential return in terms of carbon storage, water filtration, and biodiversity.
Future updates are expected to improve lowland mapping resolution, and to integrate real-time data from emerging technologies like peat surface motion cameras and InSAR monitoring.
For environmental monitoring professionals, this is more than a map: it’s a multi-layered diagnostic instrument for the landscape itself.
Whether you are tracking changes in peatland condition, designing a new monitoring network, or assessing restoration impacts, the England Peat Map provides the strategic clarity the sector has long needed.
IET Guide 2026

 Product directory