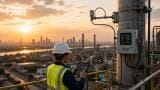
Industrial emissions
Using satellite observations over 92 major cities worldwide, with 72 of those cities having enough data to track change from 2019 to 2023, the researchers found that urban methane emissions in 2023 were 6% higher than in 2019 and 10% higher than in 2020.
The paper was published in Proceedings of the National Academy of Sciences (PNAS).
The study compares atmospheric observations from the TROPOMI instrument aboard the Copernicus Sentinel-5 Precursor satellite with what the researchers describe as 'bottom-up' or accounting-based estimates.
Those accounting methods suggested that urban methane emissions had risen by only 1.7% to 3.7% since 2020, well below the increase indicated by the satellite data.
To understand why that matters, it helps to be clear about what inventory-based estimates actually are. An emissions inventory is usually built source by source.
A city estimates methane from landfills, wastewater treatment, gas distribution infrastructure and other known activities, then adds those estimates together to produce a total.
In practice, this often means using activity data and emission factors: the quantity of waste, fuel, pipe, throughput or facility activity is multiplied by an assumed rate of methane release.
That is why inventory-based estimates and emission factor calculations are closely related, even though the broader inventory may also include engineering assumptions, reported facility data and other modelled inputs. The Michigan team’s point is that these accounting-based totals appear to be missing something.
That missing piece could take several forms. Some sources may not be fully counted. Some emission factors may be too low. Some urban systems may be changing faster than inventories are updated.
Methane is especially vulnerable to undercounting because it often comes from diffuse, intermittent or deteriorating systems: ageing gas networks, landfill operations, wastewater infrastructure, and other sources that do not always emit at a neat average rate.
The study does not solve source attribution for every city but it does show that the atmosphere above those cities is not behaving as many official estimates would suggest.
That has direct implications for cities that have already made climate pledges. The study included more than half of the C40 network, and the researchers report that methane emissions across the studied C40 cities were also 10% higher in 2023 than in 2020.
According to the University of Michigan release, those cities now face nearly 2 additional teragrams of methane emissions per year, equivalent to about 30% of their methane reduction target.
The striking part is that C40 cities were rising at a similar rate to non-participating cities, suggesting that membership of a climate network does not by itself guarantee that methane is being measured properly, let alone reduced.
For environmental monitoring professionals, the paper is really about verification. Satellite observations are beginning to act as an external audit of urban emissions inventories. TROPOMI provides daily surface coverage over land under suitable conditions and has a methane spatial resolution of 7.0 × 5.5 km since August 2019.
That is good enough to identify city-scale methane enhancements and track broad trends over time. It is not good enough, on its own, to tell a city exactly which landfill cell, wastewater asset or leaking gas corridor is responsible. The researchers explicitly note that higher-resolution satellite measurements will be needed to separate the contribution of large localised sources.
That limitation is not a weakness so much as a signal that methane monitoring now needs to be layered. Wide-area satellite data can indicate whether a city’s total methane burden is consistent with its official inventory.
Once a discrepancy appears, the work shifts to more granular methods: fixed-site monitoring, mobile leak detection, aerial surveys, facility-level measurements, and better reconciliation between atmospheric evidence and inventory assumptions. In that sense, the study strengthens the case for integrated methane monitoring rather than replacing one method with another.
The study also points to a broader rebalancing of methane policy. Much of the recent political attention around methane has focused on oil and gas 'ultra emitters', yet the researchers’ measurements suggest that urban methane emissions accounted for about 10% of all human methane emissions in 2023 and were nearly four times higher than the ultra-emitter sources emphasised in previous studies and mitigation efforts.
That does not diminish the importance of oil and gas methane control, but it does suggest that urban systems may deserve more monitoring scrutiny than they have received so far.
The message for cities is fairly stark. You cannot manage methane effectively if your inventory is incomplete. The message for the monitoring sector is more encouraging. Urban methane accounting is becoming something that can be independently checked from space.
As that capability improves, inventories based largely on emission factors and source assumptions will face increasing pressure to match what the atmosphere is actually showing. For instrument users, that makes methane less of a paper exercise and more of a measurement problem.
IET 36.2 Mar/Apr 2026


.jpg)