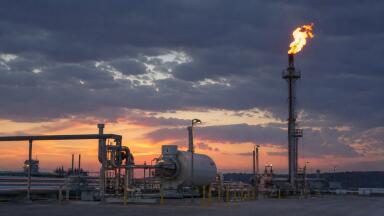
Industrial emissions
Let's break down how the EU allocates emissions quotas based on national inventories, and where each country stands in the current rankings.
Under the UNFCCC framework, countries submit annual greenhouse gas (GHG) inventories using IPCC guidelines.
These inventories form the accounting backbone for climate targets. In the Kyoto era, these inventories directly informed country-level emissions quotas.
Today, under the Paris Agreement, each country sets its own targets (NDCs), but those targets are still tracked against the inventory data.
The EU adds a robust enforcement layer on top of this: the EU Emissions Trading System (EU ETS). Covering about 40% of the EU's total emissions, the ETS sets an overall cap, converted into emissions allowances (1 allowance = 1 tonne CO2e).
Companies in power, heavy industry, aviation, and now shipping must monitor and report their emissions and surrender enough allowances to cover them.
If they exceed their allowance, they must buy more on the market or face fines.
So where do quotas come in? Allocation of these allowances is split between free allocation (to prevent carbon leakage) and auctioning.
The auctioned share is split among EU member states in proportion to their share of verified emissions at the system's start, with a solidarity buffer for lower-income countries.
This means countries with historically high emissions, like Germany and Poland, receive a larger share of the EU-wide auction quota.
According to the latest EU and EEA data (2023), Germany remains the top emitter (~682 Mt CO2e in 2023), with the largest allocation of EU ETS allowances.
Poland (~364 Mt) and Italy (~374 Mt) follow closely and are also among the top allowance recipients.
France, with lower-carbon electricity, receives fewer ETS allowances despite having the second-highest total national emissions (~386 Mt). Spain (~285 Mt) ranks fifth in both emissions and quota terms.
Under the Effort Sharing Regulation, emissions outside the ETS, like road transport and agriculture, are also capped, with national emission budgets set based on GDP per capita.
Sweden and Germany face stricter caps, while Poland and Romania are granted more flexibility.
The correlation mechanism is clear: emissions inventories provide the quantitative basis, and quotas, through ETS and Effort Sharing, translate that data into binding constraints and financial instruments.
If you work in compliance or procurement, your country's historical emissions and sectoral exposure to ETS will shape your organisation's allowance strategy.
Keep an eye on both ETS trends and Effort Sharing allocations, they evolve as inventories are updated.
IET 36.3 May