Water/wastewater
Published over 7 years ago. See the latest and most current information on Water/wastewater.
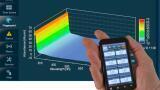
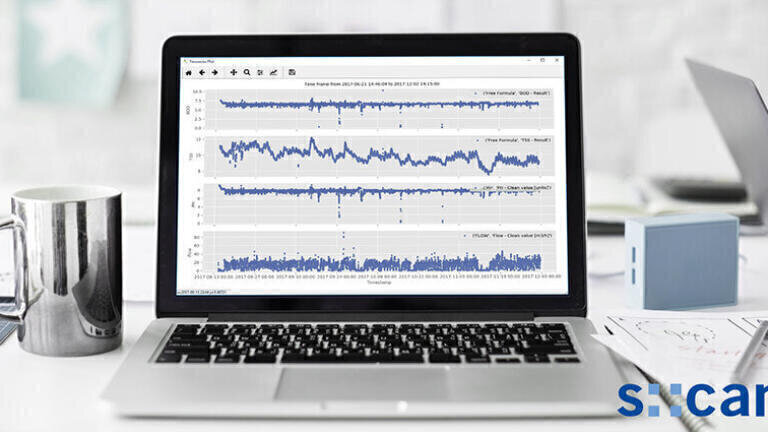
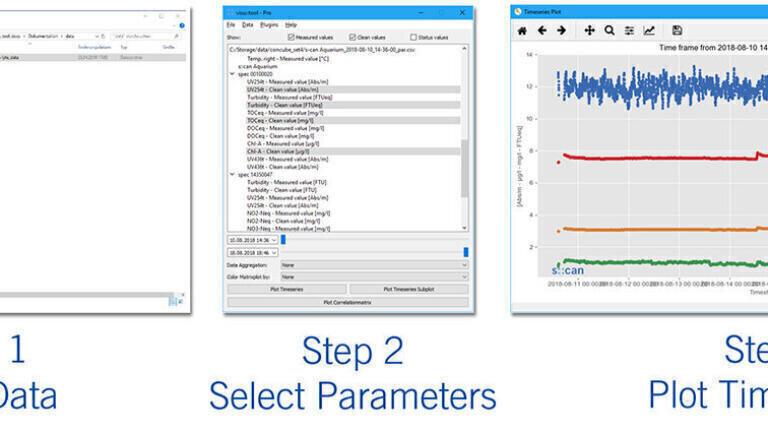
s::can introduces visu::tool, a fast and easy-to-use data visualisation software for PCs and notebooks. In just 3 simple steps you can visualise huge amounts of data from the terminals con::cube or con::lyte into single or multiple graphs.
The visu::tool "lyte" version is available for free on the s::can customer portal. The advanced visu::tool "pro” version includes a vast amount of useful offline features such as data aggregation, fingerprint plots, parameter correlation and is now available for sale.
The visu::tool lyte - data visualisation and analysis tool can read con::cube (moni::tool), con::lyte, ana::pro und visu::tool output files through a convenient “drag-and-drop” user interface and filter loaded data to show parameter status columns or hide them. Operators can select any number of parameters and plot them in one line graph, or plot them each in a separate graph and plot status codes along with parameter data. The created graphs can be saved as images, copied and pasted to Word and are allowed for zooming and customisation. You can also select any number of parameters and get their statistics to copy and paste them in Excel, save all loaded parameters or only selected parameters to an Excel file
The visu::tool pro - advanced data visualisation and analysis tool has all of the features from the "lyte" version, as well as filter loaded data for measured values and/or clean values, slider bars for data filtering along the time axis before plotting a graph and data aggregation functions to plot hourly, daily, weekly and monthly values. Users can plot status codes along with parameter data, plot fingerprints and select parameters and correlate them in a correlation matrix. Optionally, you can choose to plot your correlations ordered by color to detect drifts or other time dependent effects
Customer specific features, such as a special types of graphs, or even small reports can be implemented on demand.
IET Guide 2026

 Product directory