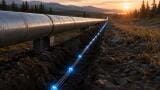
US: why the heat dome should be tracked as a normal seasonal event

Weather monitoring

US: why the heat dome should be tracked as a normal seasonal event

26 Jun, 2025

As climate change accelerates, the once-rare heat dome phenomenon has become a recurring and destructive feature of the North American summer.

In 2021, the Pacific Northwest saw record-breaking deaths and crop failures under a punishing dome of high pressure. 

Then in 2023 and again in 2025, much of the central and southern U.S. endured prolonged heat dome conditions, with daytime highs soaring above 45°C and overnight lows offering little relief.

But while the media has grown accustomed to reporting on these events, covering heat records, death tolls and power grid strain, we still lack a coherent, science-driven approach to keeping tabs on their development, as we would with, say, hurricanes or wildfires.

Let's explore what we currently track, what we neglect, and how a modern, integrated system could help us anticipate, understand, and manage these intensifying heat events.


If you're looking to monitor weather parameters, take a look through our international directory of companies supplying weather monitoring equipment.


What is a heat dome?

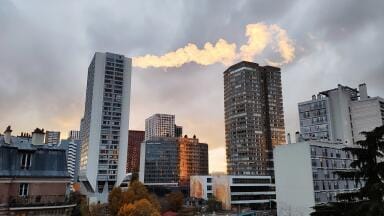
A heat dome forms when a persistent high-pressure system traps hot air over a region. 

The air sinks, compresses, and heats up, while convection is suppressed, cloud formation is limited, and cooler air can’t mix in. 

The result: solar radiation accumulates day after day, and heat builds up near the ground, dramatically amplifying thermal stress.

This phenomenon is often tied to disruptions in the jet stream, especially those driven by Arctic warming. which can cause weather patterns to become stationary or distorted ('weather blocking'). 

As a result, heat domes are now more frequent, more intense, longer lasting, and more geographically widespread than in the past.

The gaps in the data

Despite their growing importance, heat domes are not being monitored comprehensively. 

Most systems still rely on surface air temperature, which tells only part of the story. 

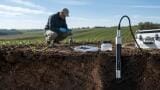
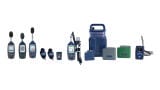
A complete understanding requires data from a range of environmental factors, many of which are poorly tracked or overlooked entirely.

Key gaps include:

  • Wet bulb globe temperature (WBGT): This composite heat stress index is rarely measured outside of military or athletic settings, yet it ought to be measured far more widely.
  • Air quality indicators: Ground-level ozone and PM2.5 levels spike during heat domes due to stagnant air and increased photochemical reactions, but are often treated as separate issues.
  • Soil conditions: Temperature and moisture data are critical for agriculture, fire risk, and hydrological cycles, yet remain patchy and poorly integrated.
  • Vertical temperature profiles: Understanding how heat is trapped in the atmosphere requires real-time data from the surface to the boundary layer, which is seldom collected.
  • Water use: Rising demand and abstraction rates during heat domes are under-reported, thanks to outdated infrastructure and a lack of mandatory real-time tracking.

What a monitoring-first response would look like

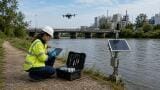
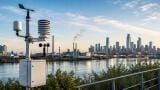
To fully track and manage heat domes, we need a vertically and horizontally integrated approach that combines satellite imagery, ground-based sensors and real-time system monitoring. 

This could include:

  • High-resolution thermal satellite data from missions like ECOSTRESS, Sentinel-3, or Landsat to track land surface temperature dynamics.
  • Distributed sensor networks measuring WBGT, dew point, humidity, and soil moisture, especially in vulnerable communities, agricultural zones, and energy-critical areas.
  • Boundary layer monitoring using tools like LIDAR and atmospheric profilers to capture the vertical structure of trapped air masses.
  • Air quality co-monitoring to track ozone and particulate concentrations in parallel with heat data.
  • Water and energy telemetry systems capable of reporting real-time abstraction, infrastructure stress and cascading failures.

Secondary impacts that need sensing

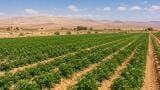
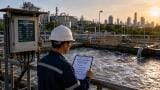
Heat domes don’t just strain human health, they destabilize entire ecosystems and infrastructure networks. 

Their knock-on effects are diverse and measurable, if we choose to track them:

  • Soil degradation accelerates under extreme heat, affecting both agriculture and dust levels.
  • Aquatic ecosystems suffer from thermal pollution and oxygen loss, threatening biodiversity.
  • Air stagnation worsens urban smog and regional pollution episodes.

Each of these impacts represents a monitoring opportunity and a chance to respond more effectively.

Preparing for future heat dome seasons

To meet the challenge, we should:

  • Establish a national heat dome monitoring network, modelled on hurricane and wildfire tracking systems.
  • Begin naming and categorizing heat domes as trackable events, with formal alert levels and public dashboards.
  • Invest in community-based sensors that contribute localised data to national monitoring platforms.
  • Develop new heat stress indices tailored to infrastructure, ecosystems and at-risk industries.

The heat dome is not merely a weather anomal, it’s a structural stress test for our entire environmental monitoring system.

If we only track surface temperature, we miss the real story: soil drying out, grids faltering, air thickening with ozone, and groundwater levels falling. 

To build resilience in a hotter world, we need better instruments, smarter indices and a holistic understanding of heat domes as multi-system environmental crises.

IET 36.2 Mar/Apr 2026

Explore our Digital Edition

Discover the latest news and research

Digital edition

Explore Our Other Sites

Labmate Online
Collaboration bridges AI design and viral vector validation
Explore more Arrow
Pollution Solutions Online
Next-generation reverse osmosis membranes for more efficient and cost-effective seawater desalination
Explore more Arrow
Petro Online
An evolution in modern fuel testing
Explore more Arrow
Chromatography Today
Chromatography and XFEL imaging reveal critical point behind water’s behaviour
Explore more Arrow