Water/wastewater
Published over 9 years ago. See the latest and most current information on Water/wastewater.
The quality of drinking water is regulated by a variety of quality requirements, defined; for example, in the form of limits specified by EU Council Directive 98/83 [1]. The decisive principles behind the definition of the limits – besides health-hazard aspects – also include sensory and technical reasons [2].
One example for the definitions described above is that of iron. The EU Council Directive 98/83 (version of 3 November 1998) classifies iron as an indicator parameter, i.e. in the concentrations present in drinking water, iron does not have a health-damaging effect [3]. The WHO classifies iron as follows: “Not of health concern at levels found in drinking water” [4]. Raised concentrations of iron, however, result in the formation of iron hydroxide products, which in turn form deposits in the water-pipe system and to the brown discoloration of the water coming out of the tap [5].
To safeguard the supply of clear and colorless water, country-specific limits have been set for drinking water. The limit for iron set e.g. by the EU directive is 0.2 mg/L Fe [3], while the US environmental agency, the EPA, specifies a limit for the concentration of iron of 0.3 mg/l [6].
Regarding the prevention of the formation of iron deposits in the water-pipe system, the German Technical and Scientific Association for Gas and Water (DVGW) recommends that a limit of 0.02 mg/L should not be exceeded [7].
As a measure to ensure that the specified limits and recommendations are complied with, drinking water is in many cases subjected to a treatment step in which the iron present in the water is precipitated. This method virtually eliminates any iron content, reducing the iron concentration to a level in the lower ppb range [7].
The accurate determination of such low concentrations requires a highly sensitive analytical method. Conventional procedures that enable quantification down to the trace range include flame atomic absorption spectroscopy (flame AAS, F-AAS) and also optical emission spectrometry with inductively coupled plasma (ICP-OES). Depending on the dosage volume the measuring range of the F-AAS method according to DIN EN ISO 38406-32 is 0.002–0.020 mg/L Fe. The limit of quantification (LOQ) for the ICP-OES method according to DIN EN ISO 11885 lies at 0.002 mg/L Fe [8,9]. Measured according to the ICH Q2 standard, the ICP-MS method used at Merck achieves an LOQ of 0.0007 mg/L Fe.
Analysis of iron using analytical test kits (rapid photometric methods)
When it comes to obtaining a swift, sensitive result without having to make a high investment in instruments, rapid photometric methods offer a practical alternative.
Test kits are generally characterized by their easy handling and speed of the procedure. The choice of the type of method depends on the specific area of application, the measuring range, and the accuracy of the measurement to be achieved. In the case of iron, the user can choose between two sensitive photometric methods.
The determination of iron using the 1,10-phenanthroline method according to APHA 3500-Fe B and DIN 38406-1 enables photometric measurement down to a level of 0.01 mg/L, which is entirely sufficient for many samples [10].
In the case that iron is to be measured with a far greater degree of sensitivity, the user can select the triazine method. In this method, all iron ions are reduced to iron(II) ions. These then react in a thioglycolate-buffered medium containing a triazine derivative to produce a red-violet complex, which is subsequently determined photometrically [11]. When using a 100-mm cell and the Prove 600 UV-VIS spectrometer from the Spectroquant® Prove product range, iron concentrations as low as 0.0025 mg/L can be measured.
In the case of drinking water, such low concentrations are, due to the treatment stage and the by nature low content of iron in groundwater, not infrequently encountered.
For this reason, the user should give preference to the more sensitive triazine method in this case. Merck offers this method in the form of Spectroquant® Iron Test, Cat. No. 114761, which has an overall measuring range of 0.0025-5.00 mg/L Fe. Used in conjunction with the corresponding Spectroquant® photometers, in which the method is already pre-programmed, the time-consuming procedure for the calculation of a calibration curve can be fully omitted.
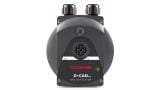
Fig. 2: Spectroquant® Prove 600
Sample preparation and performance of the measurement with Spectroquant® Iron Test 114761
Very few steps are required for preparing the sample and the actual measurement of the iron content. Samples must first be acidified with nitric acid to stabilize the iron, while carbonic acid-containing samples must also be first degassed in an ultrasound bath.
For the sensitive measurements in the 100-mm cell in the 0.0025 – 0.500 mg/L Fe measuring range, first 20 mL of the sample solution is pipetted into a suitable reaction vessel, after which 12 drops of the Fe-1 reagent are added. After a reaction time of 3 minutes, the solution is transferred to the 100-mm cell and measured in the photometer.
A detailed description of the measurement procedure is given in the application “Sensitive determination of iron in drinking water, mineral water, groundwater, and spring water”. The application can be downloaded from the product page for Spectroquant® Iron Test 114761.
Measuring iron: Method comparison ICP-MS vs. Spectroquant® Iron Test 114761
In an experiment to gain an expressive statement on the suitability of the Spectroquant® test kit for the determination of the iron content in drinking and mineral water, the iron content of five different mineral waters was measured. The results were verified by reference analysis with the ICP-MS method (see Tab. 1). The LOQ of the ICP-MS method was determined according to ICH Q2, yielding a result of 0.0007 mg/L.
As Tab. 1 shows, in all mineral waters the iron content lies below the LOQ of the respective method.
Tab. 1: Iron content of mineral waters – comparison of the ICP-MS method and Spectroquant® Iron Test 114761
Besides being subjected to the reference analysis procedure, the five samples were treated for analysis using the standard addition principle. Each sample was spiked with three different concentrations of iron and the respective recovery rates were determined. The results are shown in Tab. 2 and Fig. 3.
Tab. 2: Iron content recovered after standard addition
The added concentrations of iron were accurately recovered. The recovery rates in the spiked samples ranged between 89% and 99% over all experiments, with an average recovery rate of 95%.
If an even greater accuracy of the analysis is called for, the user can plot a custom calibration curve. Tab. 3 shows the performance characteristics of the pre-programmed method for Cat. No. 114761 determined according to DIN 38402 A51 + ISO 8466-1 compared against a calibration curve for the measurement range 0.0005 – 0.0100 mg/l Fe separately plotted using the test kit. The calibration curve is shown in Fig. 4.
At 4.35%, the coefficient of variation of the custom calibration curve is 3.3 times higher than that of the pre-programmed method. This is due to the fact that in relative terms deviations have a stronger effect in the lower measurement range as a result of the custom calibration. Seen in absolute terms, the custom calibration procedure can however, result in considerably lower method errors, as shown by the values of the method standard deviation and the method confidence interval for P=95%, which are 13 to 14 times lower than those of the pre-programmed method.
In the case of the standard additions, the use of the custom calibration resulted in a further enhancement of the recovery rate, which now achieved a mean value of 101%. The individual values lay between 95% and 106 % (see Tab. 4). Fig. 5 gives a graphic representation of the results.
Since mineral waters have only a low content of iron, the experiments were also carried out using samples of groundwater and spring water, whose iron concentrations are naturally higher due to the lack of any water treatment. The measurement was carried out using the pre-programmed method. Here too, the measurement results were verified by reference analysis using the ICP-MS method. Tab. 5 shows a comparison of the results obtained with the two methods.
The results yielded by the Spectroquant® Iron Test are in good agreement with those obtained using the ICP-MS method. Due to the very high iron content of the Bensheim groundwater sample of 2.7 mg/L Fe, in deviation from the defined procedure a 10-mm cell was used. The recovery rate here was 100%. These results show that even very high concentrations of iron can be precisely determined by means of the iron test.
In the case of the spring-water samples, the measurement results differed by a maximum value of 0.0008 mg/L. Even those iron concentrations that lay below the measuring range were confirmed by the ICP-MS measurements.
The Spectroquant® Iron Test 114761 offers a good alternative to ICP or AAS when it comes to determining the iron content in drinking water, mineral water, groundwater, and spring water. The method yields results comparable to those obtained by the ICP-MS method and is easy to perform. For all laboratories for which the purchase of an ICP-OES or ICP-MS system is inexpedient for economic reasons, the Spectroquant® Iron Test Cat. No. 114761 offers a swift, sensitive, and precise alternative for the determination of the iron content of drinking water, mineral water, groundwater, and spring water.
Chemicals, samples, and instruments used:
All measurements were conducted using a Prove 600 instrument as per the application. The reference system used was an HR-ICP mass spectrometry method on the Element 2 device supplied by Thermo Fisher Scientific.
[1] Ordinance of the DVGW (Deutscher Verein des Gas- und Wasserfach, German Technical and Scientific Association for Gas and Water), Ver¬ordnung über die Qualität von Wasser für den menschlichen Gebrauch, TrinkwV 2001, edition of 10 March 2016.
[2] H. H. Dieter, Grenzwerte, Leitwerte, Orientierungswerte, Maßnahmenwerte – Aktuelle Defi¬ni¬tionen und Höchstwerte, Bundesgesundheitsbl 52, 1202–1206, 2009.
[3] Council Directive 98/83/EC of 3 November 1998 on the quality of water intended for human con-sumption, 1998.
[4] World Health Organization, Guidelines for Drinking Water Quality, 2011.
[5] H. D. Belitz, W. Grosch, P. Schieberle, Lehrbuch der Lebensmittelchemie, Springer Berlin Heidel-berg, 2001.
[6] United States Environmental Protection Agency, 2012 Edition of the Drinking Water Standards and Health Advisories, EPA 822-S-12-001, 2012.
[7] DVGW (Deutscher Verein des Gas- und Wasserfaches, German Technical and Scientific Associa-tion for Gas and Water), Enteisenung und Entmanganung; Teil 1: Grundsätze und Verfahren, Arbeitsblatt W 223-1-2005-02, 2005.
[8] DIN 38406-32:2000-05, Deutsche Einheitsverfahren zur Wasser, Abwasser- und Schlammunter-suchung – Kationen (Gruppe (E), Bestimmung von Eisen mittels Atomabsorptionsspektrometrie, 2000.
[9] DIN EN ISO 11885:2009-09, Wasserbeschaffenheit – Bestimmung von ausgewählten Elementen durch induktiv gekoppelte Plasma-Atom-Emissionsspektrometrie (ICP-OES), 2009.
[10] Package leaflet Spectroquant® Iron Test, Cat. No. 100796, June 2016.
[11] Package leaflet Spectroquant® Iron Test, Cat. No. 114761, June 2016.
IET 36.3 May