Mass spectrometry & spectroscopy
Published over 4 years ago. See the latest and most current information on Mass spectrometry & spectroscopy.
Microflow LC was compared to analytical flow LC for the analysis of 69 commonly analysed pesticides. An increase in sensitivity was seen for all 69 pesticides. The OptiFlow Turbo V ion source on the QTRAP 6500+ system allows for more sensitive environmental methods. It can play a key role in environmental monitoring efforts at lower limits of detection.
Liquid chromatography (LC) has been applied to a wide range of environmental samples, and combining this with tandem mass spectrometry (MS/MS) allows for highly sensitive and accurate measurements [1]. A large majority of LC-MS/MS methods rely on electron spray ionisation (ESI), which is susceptible to matrix effects, including ion suppression [1]. However, the versatility of ESI and the wide range of compounds of environmental concern that can be analysed using this method have made LC-MS/MS a critical tool for environmental research and monitoring. As LC-MS/MS becomes a more important tool for analysing nonvolatile and polar contaminants, research has focused on creating more sensitive methods. Microflow LC has been shown to achieve sensitivity gains but, until recently, has primarily been used for peptide LC-MS/MS quantification due to the sensitivity requirements of these particular assays.
Microflow LC operates at significantly lower flow rates than traditional analytical high-performance LC systems, typically in the range 1–200 µL/min [1,2]. The sensitivity gains resulting from these lower flow rates arise for a few reasons. Primarily, atmospheric pressure-based mass spectrometers have much higher ion sampling efficiencies at lower flow rates. With recent advances in ion sampling, the sensitivity gap between microflow and nanoflow analyses (< 1 µL/min) is closing (Figure 1) [3]. This makes the microflow chromatography extremely attractive as it can give significant sensitivity gains without the extreme robustness, low sample capacity and low throughput of nanoflow chromatography. Beyond sampling capacity, the smaller droplets generated from microflow rates allow for more ions to be generated by ESI. Additionally, by decreasing the size of these droplets, ion suppression effects can be minimised, as there are fewer molecules to compete for charge [1]. This should be extremely valuable for food and environmental matrices since these matrices are notoriously complex, even after extensive sample extraction techniques [2,4].
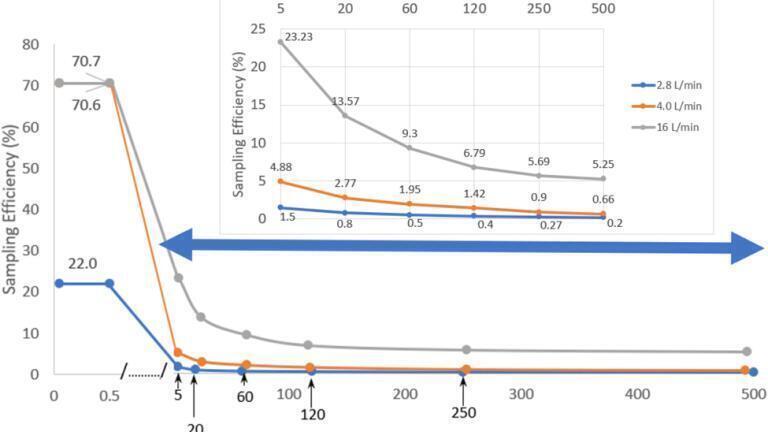
Figure 1. Electrospray sampling efficiency taken across 4 orders of magnitude in flow rate.
As MS sampling capacity increases from 2.8 L/min (blue trace) to 4.0 L/min (orange trace) and 16 L/min (grey trace), increases in ion sampling efficiency can be observed at a given LC flow rate. Further, as MS sampling capacity increases, the gap between sampling efficiency in the nanoflow regime (< 1 µL/min) and the microflow regime beings to close. The figure used with permission [3].
Here, a comparison of microflow LC and analytical flow LC for the analysis of 69 frequently analysed pesticides was performed.
One of the key objectives of this study was to compare microflow and analytical flow HPLC methods combined with MS/MS. To accomplish this, parameters were kept as consistent as possible between the two methods. The MS/MS conditions that are compound-specific were kept consistent between the two methods. Only source and gas conditions were optimised for their appropriate flow rate. The data were processed using SCIEX OS software 1.7. The HPLC column chemistry and particle size were also kept constant. Only the column dimensions appropriate for each flow rate were changed.
The HPLC separation was carried out using an LC system (ExionLC AD, SCIEX) equipped with two binary pumps (LC-30AD, SCIEX) and a column oven (CTO-30A, SCIEX). The chromatography column used was a Luna Omega 3 µm Polar C18 100 Å 100 × 4.6 mm (Phenomenex), and the temperature was maintained at 45°C. The gradient conditions are outlined in Table 1. The injected sample volume was 1 μL. The extracted sample was analysed using a QTRAP 6500+ system equipped with an IonDrive Turbo V ion source.
The microflow analysis was performed using an microflow LC system (M5 MicroLC, SCIEX) at a flow rate of 15 µL/min. An identical stationary phase was used in a smaller diameter column (Luna Omega 3 µm Polar C18 100 Å 100 x 0.5 mm, Phenomenex). The gradient conditions are outlined in Table 2. A 1 µL sample volume was directly injected. The same mobile phases were used, but the gradient was optimised for the low flow rate. The sample was analysed using the same QTRAP 6500+ system equipped with an OptiFlow Turbo V ion source that was designed specifically for lower flow rates.
Table 1. Comparing gradients used for microflow and analytical flow LC.
Analytical Flow (800 µL/min) Microflow (15 µL/min)
Time % B Time (min) %B
0 55 0 0
0.5 55 1 10
2.5 80 5 40
8.5 90 7 80
12.5 100 9 100
16.5 100 16 100
16.6 55 16.1 0
Mobile phase A: 100% water + 0.1% formic acid, 5mM ammonium formate
Mobile phase B: 100% acetonitrile + 0.1% formic acid, 5mM ammonium formate
The sensitivity between microflow and traditional analytical flow LC was compared by dividing the signal to noise (S/N) for the compound using the microflow method by the signal to noise of the compound using the analytical flow method. This ratio was measured at two points: (1) the lowest point of the calibration curve in the analytical flow data and (2) the highest point of the microflow calibration curve (Figure 2). The lowest point of the analytical flow data was used because the microflow method provided calibration curve points below the LOQ of the analytical flow method. The highest point of the microflow calibration curve was used because detector and source saturation occurred first in the microflow LC data. Both the low point and high point calibration points were compound-dependent.
All 69 of the compounds saw an increase in S/N using microflow LC at the low concentration point. Over half of the compounds tested had an increase in S/N greater than 10-fold (Figure 2, green). Further, three compounds were observed in the microflow data method that were not observed in the analytical flow method: methyl parathion, chlorfenapyr, and avermectin B1b. The average S/N improvement at the low point was 29, with a standard deviation of 39 and a median value of 12 (Figure 3, green). The three outliers that were observed in Figure 3 were dichlorvos, trifloxystrobin, and bifenthrin, with S/N gains in microflow of 239, 143, and 95, respectively.
It can be noted that the improvements in S/N at the low point of the calibration curve were approaching or in some cases greater than, the gains observed in the raw area (Figure 3). As flow rates lower, there are fewer background ions from solvent impurities which often results in less chemical noise and, thus, a further increase in S/N.
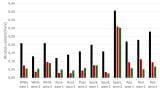
Figure 2. Signal to noise (S/N) gains between microflow and analytical flow LC. Here the S/N was compared at the LLOQ of the analytical flow data (green) and the highest point of the microflow data (purple). All 69 compounds analysed saw an increase in S/N over analytical flow at its LLOQ. Many compounds had significant S/N gains of 5 fold or higher.
The S/N ratios between microflow and analytical flow were also compared at the high concentration point of the microflow curve. Of all compounds, 28 had an S/N improvement greater than 10 fold (Figure 2, purple). The average high standard S/N ratio was 14, with a standard deviation of 23 and a median value of 7 (Figure 3, purple). The 7 outliers observed were fipronil, cypermethrin, dichlorvos, spinosyn D, acequinocyl, phosmet, and imidacloprid, with ratios of 110, 110, 85, 55, 52, 47, and 37, respectively.
Figure 3. Comparison of S/N gains in microflow vs. analytical flow HPLC. Again the S/N ratios for each compound between the flow regimes were compared at the low (green) and high (purple) concentration points. A range in S/N gains was observed at each, but most compounds showed S/N gains. The peak areas between microflow and analytical were also compared (orange) at the low concentration point.
It can be noted that the improvements in S/N at the low point of the calibration curve were approaching or in some cases greater than, the gains observed in the raw area (Figure 3). This highlights that improvements in signal afforded by microflow chromatography often come with negligible changes in noise. Examples of the MRM chromatograms highlight the signal gains and the S/N gains observed in the microflow LC experiments (Figure 4).
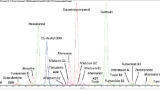
Figure 4. Example of chromatograms comparing the two different flow regimes. MRM chromatograms comparing microflow liquid chromatography (blue) and traditional analytical flow liquid chromatography (orange) for four selected pesticides are shown: A) spinosyn D, B) imidacloprid, C) coumaphos.
It was observed that the distribution in gains in both raw signal and S/N were greater than those that could be described by improvements in sampling efficiency alone (Figure 1). Several factors were investigated to determine the cause of the increase in sensitivity, including pKa, Log P, polar surface area, and temperature sensitivity. A Kendall’s rank correlation was performed to identify significant correlations. Temperature sensitivity was found to have the largest impact on S/N improvements at microflow rates. Optimum droplet desolvation during the ionisation process generally occurs at high temperatures and gas flows, but some compounds are susceptible to thermal degradation. Since microflow source conditions typically require lower temperatures and gas flows for optimal sensitivity, these temperature-sensitive compounds are less susceptible to thermal degradation and see an enhanced performance.
To determine the compounds’ temperature sensitivity, a standard containing all the pesticides was injected at a series of source temperatures, ranging from 350°C to 550°C in 50°C increments. The area was then plotted against the source temperature and a linear regression model was used to calculate the slope. The slope of this line was used to represent the compounds’ temperature sensitivity. There was a significant correlation between the slope of this line and the increase in sensitivity.
To further assess this relationship, two groups were made: (1) compounds with a negative slope and an r2 above 0.7, and (2) compounds with a positive slope and a r2 above 0.7. The compounds with a negative slope saw an increase in area with lower source temperatures. In comparison, the compounds with a positive slope saw an increase in area under higher source temperatures. It was found that the compounds that benefitted from a lower temperature had a median value of ~4x higher than the compounds that benefitted from higher temperatures (Figure 5).
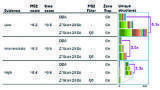
Figure 5. Impact of source temperature on pesticide signals. Signal to noise (S/N) ratios at the low concentration point were compared between microflow and analytical flow for the two observed classes of compounds: those that saw an increase in intensity with lower source temperatures (red) and those that saw an increase with higher source temperatures (blue).
Microflow LC was compared to analytical flow LC for the analysis of 69 commonly analysed pesticides. An increase in sensitivity at the low point of the concentration curve was seen for all 69 pesticides. A major factor in the observed increase in S/N was temperature sensitivity. Compounds that were temperature sensitive experienced a larger increase in the S/N ratio. The M5 Microflow LC system coupled with an OptiFlow Turbo V ion source allows for more sensitive environmental methods. It can play a key role in environmental and food monitoring efforts as lower limits of detection (LOD) are required to protect the public health.
1. Uclés Moreno A, et al. (2015) Microflow Liquid Chromatography Coupled to Mass Spectrometry-an Approach to Significantly Increase Sensitivity, Decrease Matrix Effects, and Reduce Organic Solvent Usage in Pesticide Residue Analysis. Anal. Chem. 87 (2), 1018–1025.
2. Herrera López S, et al. (2016) Screening of Pesticide Residues in Honeybee Wax Comb by LC-ESI-MS/MS. A Pilot Study. Chemosphere 163, 44–53.
3. Schneider, Bradley B, et al. (2021) Sampling Efficiency Improvement to an Electrospray Ionization Mass Spectrometer and Its Implications for Liquid Chromatography Based Inlet Systems in the Nanoliter to Milliliter per Minute Flow Range. J. Am. Soc. Mass Spectrom. 2021, 32, 6, 1441–1447
4. Gil García MD, et al. (2017) MCM-41 as Novel Solid Phase Sorbent for the Pre-Concentration of Pesticides in Environmental Waters and Determination by Microflow Liquid Chromatography-Quadrupole Linear Ion Trap Mass Spectrometry. Microchem. J. 134, 181–190.
Robert A. Di Lorenzo, Ph.D., Global Technical Expert, Food and Beverage Testing at SCIEX, Toronto, Canada, and Karl Oetjen, Ph.D., Senior Application Scientist, Cannabis, Environmental and Food and Beverage Testing for North America at SCIEX, Colorado, USA.
The SCIEX clinical diagnostic portfolio is For In Vitro Diagnostic Use. Rx Only. Product(s) not available in all countries. For information on availability, please contact your local sales representative or refer to www.sciex.com/diagnostics. All other products are For Research Use Only. Not for use in Diagnostic Procedures.
Trademarks and/or registered trademarks mentioned herein, including associated logos, are the property of AB Sciex Pte. Ltd. or their respective owners in the United States and/or certain other countries (see www.sciex.com/trademarks).
© 2021 DH Tech. Dev. Pte. Ltd. RUO-MKT-19-13565-A
IET 36.2 Mar/Apr 2026


.jpg)