Laboratory products
The global ready-to-drink (RTD) beverage sector continues to expand, requiring reliable analytical control of alcohol and sugar components throughout production and shelf life. This article presents a technical evaluation of an integrated RTD measurement system for determining alcohol, sugar concentration, and sugar inversion in alcoholic RTDs, including those containing high-fructose corn syrup (HFCS). Results demonstrate high precision, improved alignment with distillation reference values, and the capability to quantify inversion and fresh-density parameters essential for consistent quality assurance.
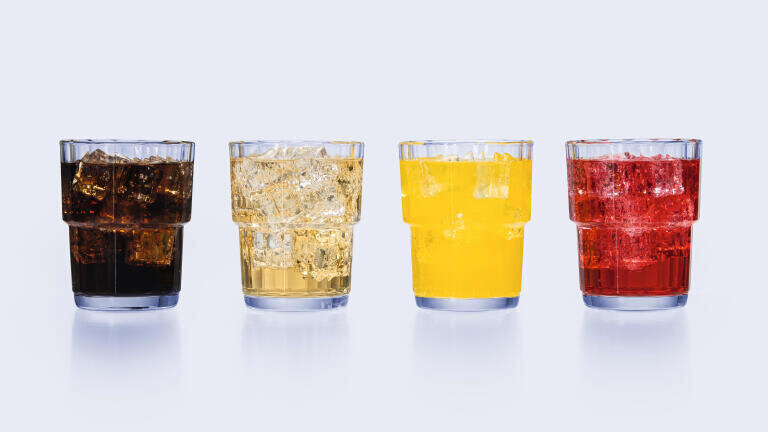
Alcoholic RTDs encompass a broad and increasingly diverse range of beverage types designed for immediate consumption without further preparation. Common categories include spirit-based mixed drinks, such as pre-blended cocktails and long drinks that combine distilled spirits with fruit flavours, juices, or carbonated mixers. Hard seltzers form another major segment, characterised by their light, carbonated profile and low-calorie levels. Malt-based and beer-derived RTDs include flavoured malt beverages, shandies, and Radlers, offering lower-alcohol, refreshing alternatives. Wine-based RTDs, such as spritzers and aromatised wine beverages, blend wine with sparkling water, botanicals, or fruit components. In addition, hard teas, hard lemonades, and spiked sodas have gained popularity as flavour-forward options catering to consumers seeking familiar soft-drink profiles with moderate alcohol content. This breadth of formulations highlights the analytical complexity of the category and reinforces the need for precise measurement of alcohol, sugar, and inversion parameters across varying matrices.
The ready-to-drink (RTD) alcoholic beverage segment has expanded rapidly in recent years, driven by consumer demand for convenience, portability, and new flavour experiences. Globally, the RTD alcoholic beverage market is projected to grow from approximately
USD 23.1 billion in 2024 to USD 25.2 billion in 2025, with a compound annual growth rate (CAGR) near 8.8 %, and continue rising toward an estimated USD 35 billion by 2029. This trend reflects broader shifts in consumption patterns, including increased interest in pre-mixed cocktails, hard seltzers, and other low-preparation alcoholic formats that appeal to millennial and Gen Z drinkers as well as at-home and on-the-go occasions. The growth is further supported by product innovation, expanding distribution channels, and shifts toward lower-alcohol or flavoured options that align with evolving lifestyle preferences [1].
Accurate measurement becomes increasingly challenging when formulations incorporate varying sweetener systems, including sucrose (subject to inversion during storage) and HFCS variants with different fructose–glucose ratios. Sugar inversion alters density and therefore influences alcohol and Brix determination if not corrected. Analytical methods must therefore reliably capture both current and ‘fresh’ parameters to ensure meaningful comparison across production stages and retained samples.
This article describes the analytical background, methodology, and findings from the evaluation of a dedicated RTD measurement system designed to precisely measure alcohol, sugar content, and inversion in a wide variety of alcoholic RTDs.
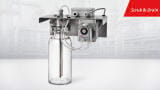
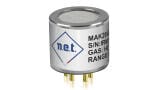
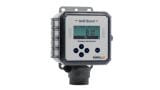
A selection of commercial alcoholic RTDs was analysed using a packaged RTD measurement system consisting of an oscillating U-tube density and sound velocity meter, an alcohol meter (NIR) for spirit analysis, a CO2 meter, and a total package oxygen meter.
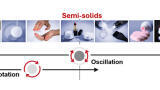
Samples were equilibrated by gently rotating sealed cans five full turns at approximately two seconds per turn to distribute CO2 uniformly. Measurements were performed at room temperature with samples at room temperature. The density meter had an accuracy of 0.000001 g/cm³ and was classified as medium precision. The alcohol module was used in 20°C mode with the ‘Cognac’ method and the CO2 meter was preset for solubility coefficients of cola-like products. All experiments were carried out at least in duplicate. Samples were purchased from local stores to reflect a wide spectrum of products and producers. As alcohol reference analysis, distillation was performed, and the distillate was analysed using a five-digit-accuracy density meter.
Two primary sweetener systems were addressed: first, sucrose-based RTDs, which are subject to sugar inversion, producing glucose and fructose in equal proportions. This process alters solution density and other parameters, requiring correction to compare fresh and stored samples. Second, HFCS-based RTDs (HFCS-42, and HFCS-55 with 42% and 55% fructose content, respectively) were analysed containing glucose–fructose mixtures with ratios differing from mixtures obtainable by sucrose inversion.
The measurement system includes parameter sets designed specifically for RTD matrices, such as corrected alcohol content, degree of inversion, and inversion-corrected (“fresh”) density and sugar content. Chemometric models were thus created based on density, sound velocity, and NIR absorption at 1,180 nm to 1,200 nm. In addition, integrated compensation of dissolved CO2, which increases the density, was applied.
These parameters ensure that alcohol and extract values are corrected for the respective sweetener type and inversion state.
Alcohol determination
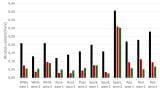
Uncorrected alcohol values from the alcohol meter were compared with distillation results and RTD-specific corrected values (Figure 1).
• Alcohol content across samples ranged from 4% v/v to 11% v/v
• Repeatability of ethanol determination was < 0.01% v/v
• Uncorrected measurements deviated from reference analysis by up to 0.2% v/v alcohol content
• Application of RTD-specific correction reduced deviations by up to 96% in the best case
One sample exhibited an increased deviation post-correction. Based on region of origin (Canada/USA) and improved alignment after applying the HFCS-55 correction, it is likely that the beverage used HFCS-55 despite not being labelled as such.
The measurement system with the newly developed chemometric models showed excellent agreement with the reference method, limiting the difference to 0.033% v/v on average. This bias, compared to legal labelling limits of 0.5% v/v in most countries, is extremely low and can partially be attributed to the accuracy of the reference data.
Sugar inversion increases solution density and modifies Brix readings. The degree of inversion enables back-calculation of inversion-corrected values. (density fresh and Brix fresh, as shown in Figure 2)
These parameters represent the product before inversion occurs.
Correlations observed:
• Density increase ranged from 0.000186 g/cm³ at 17.5% inversion to 0.002425 g/cm³ at ~88% inversion
• Brix shift ranged from 0.05 °Brix at low inversion to 0.56 °Brix at ~78.5% inversion
This demonstrates a quantifiable relationship between inversion progress and analytical deviations in uncorrected sugar determination. As sugar inversion happens spontaneously in beverages containing sucrose, proving that the beverage was produced within specifications is complicated when analysing a beverage towards the end of its shelf life.
Maintaining accurate alcohol and sugar specifications is essential for product consistency, regulatory compliance, and consumer acceptance. The complexities introduced by sucrose inversion and the growing use of HFCS make standard QC measurements less comparable with results from analysing products towards the end of their shelf life without specialised correction models.
The study confirms that RTD-specific alcohol correction models significantly improve accuracy relative to distillation. In addition, HFCS-tailored models are necessary in markets where fructose-rich sweeteners are common. It was found that inversion-related density changes are substantial enough to mislead quality control assessments if not corrected.
The inclusion of the newly developed parameters enables meaningful comparison of production samples with aged retention samples – an important advantage for shelf-life monitoring, avoiding product recalls, and legal verification.
This evaluation demonstrates that a dedicated RTD measurement system provides a reliable, high-precision method for assessing alcohol content, sugar concentration, and sugar inversion in a wide range of alcoholic RTDs.
Key benefits include:
• Significant reduction of alcohol measurement deviation from distillation references
• High repeatability for ethanol and sugar parameters
• Accurate handling of both sucrose- and HFCS-based formulations
• Ability to quantify inversion effects and determine a sample’s “fresh” analytical state
These capabilities support robust quality control, improved production efficiency, and compliance with regulatory requirements in the rapidly evolving RTD beverage market.
1. Ready to Drink (RTD) Alcoholic Beverages Global Market Report 2025, https://www.thebusinessresearchcompany.com/report/ready-to-drink-rtd-alcoholic-beverages-global-market-report
IET 36.2 Mar/Apr 2026


.jpg)

.jpg)
.jpg)