
Environmental laboratory
Published over 9 years ago. See the latest and most current information on Environmental laboratory.
Total organic carbon (TOC) analysis provides a quick and efficient analytical process for cleaning validation in the pharmaceutical industry. When a single piece of equipment in a pharmaceutical manufacturing facility processes different active pharmaceutical ingredients (APIs), cross-contamination between products must be kept to an absolute minimum. Cleaning validation is the overall process that ensures that equipment cleaning processes and procedures are removing product and cleaning agent residues to predetermined levels of acceptability as required by 21 CFR 211.67, which states that ‘equipment and utensils shall be cleaned, maintained, and sanitised at appropriate intervals to prevent malfunctions or contamination that would alter the safety, identity, strength, quality, or purity of the drug product beyond the official or other established requirements’ 1.
Cleaning Validation Procedure Development
During development of a cleaning validation procedure, the key objective is process validation: proving with analytical data that each step in the process removes both product and cleaning agent residues to predetermined levels of acceptability. The FDA’s 1993 guidelines require that the basis of any acceptance limits be ‘scientifically justifiable’. These limits vary depending on the type of cleaning procedure used (for example, clean-in-place (CIP) or clean-out-of-place (COP)) and whether the cleaning procedure is being performed between batches of the same product or to change product types. It is also important to understand the types of analytes and cleaning agent residues for which users test (for example, proteinaceous fermentation broth samples and cationic surfactants). These parameters dictate the detection method for the validation procedure.
TOC analysis is rapidly becoming the analytical method of choice for cleaning validation for several reasons. Many pharmaceutical companies are developing cleaning validation methods based on a whole-product approach: a determination is made as to whether any residue is present without regard to its origin (including products, cleaning detergents, chemicals, solvents, byproducts, degradants, and microbial contaminants). This method works well with TOC analysis, which can detect any API or cleaning agent residue that contains carbon in its molecular structure.
Jenkins et al. 2 found strong support for the use of TOC analysis in cleaning validation: ‘TOC has low-level detection, rapid analysis time, is low cost compared to other methods, and can detect all carbon based residuals’. By comparing TOC, HPLC, thin-layer chromatography, spectrophotometric (UV), enzyme-linked immunosorbent assay, electrophoresis, pH, conductivity, and visual analysis, they found that TOC analysis performed as well as or better than HPLC and spectrophometric methods.
Other reasons for the increase in reliance on TOC analysis include:
• Relatively low initial capital outlay and operational and maintenance cost
• Ease of use
• High sensitivity
• High recovery of recalcitrant analytes
• Minimal interferences
Testing the analytical technique in the developmental stages
with a model compound(s) that is representative of the types of active agents encountered in the actual cleaning validation process will demonstrate the robustness, accuracy, and precision of
the technique.
Bovine serum albumin (BSA) is a compound that can serve as a good model for other proteinaceous, difficult-tooxidize APIs. Serum albumin, a protein common in all mammalian blood plasma, is one of the most widely known and carefully characterised proteins. BSA specifically has been characterised by HNMR and X-ray crystallography as being roughly heart shaped with 607 amino acid residues and a molecular weight of approximately 66,317.25 amu 3. Widely used in the pharmaceutical industry as an active agent itself, BSA is also a good model compound for developing a robust cleaning validation analytical method. Proteins are notoriously difficult to oxidise, and when a TOC detection method is developed using a protein compound as the test agent, high confidence can be placed in the analytical results as they relate to other active agents and less oxidation-resistant analytes.
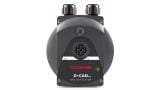
The objective of this study was to determine the linear range of response of a TOC Analyser using BSA as the model compound for the development of a cleaning validation methodology. An OI Analytical Aurora 1030W TOC Analyzer and a 1088 Autosampler (Figure 1) were used in this study.
BSA lyophilised powder (Bio-Plus Laboratories) was rehydrated using reagent water according to directions to make a parent/working stock solution (100 mg/L Carbon). BSA samples were prepared by dilution of the working carbon stock solution. Because of the proteinaceous nature of the BSA, minimal shaking of the stock standards is important, as it will adhere to other parts of the glassware and result in reduced recovery. The volumetric flask should be nearly full of DI water before adding BSA for dilution. Mixing should only be performed immediately before analysis.
The TOC Analyser was calibrated using potassium hydrogen phthalate (C9HO4K), or KHP. A premade 1,000 mg/L carbon parent stock solution was diluted with reagent water to prepare a working stock solution (100 mg/L C). Standards were prepared by dilution of the working stock solution.
For digestion of TIC in samples, 5% phosphoric acid (H3PO4) was prepared for the acid reagent. The TOC oxidant was prepared by dissolving 200 g of sodium persulfate (Na2SO8) into 1 L of reagent water. The TOC Analyser was programmed with the method parameters listed in Table 1 for the analysis of BSA.
Samples were analysed in triplicate (9 mL per replicate), and data was reported as area counts, mass of carbon (μg C), and carbon concentration (mg/L) per replicate and per sample. Statistical data reported included sample standard deviation and percent relative standard deviation.
Calibration Curve
The calibration curve used in this study (Figure 2) demonstrates the capability of the Aurora 1030W TOC Analyzer to be calibrated across a relatively wide range of carbon concentrations with high accuracy and precision. The instrument was calibrated using KHP, a widely used and easily oxidisable standard. The calibration curve in Figure 2 was generated using the PC software, which is a replica of the touchscreen software available with the Aurora 1030W. The Response Factor represents the response of the instrument in units of μg C per 1,000 area counts.
The objective of this study was to determine the linear range of response of the 1030W TOC Analyzer to BSA. This concept is similar to calibrating an instrument and reveals the working range of BSA concentrations where the instrument gives a linear response. Test results are presented in Figure 3 as a plot of BSA concentration per sample versus the response of the TOC Analyzer in area counts. The data show that the Aurora 1030W is capable of analysing BSA from approximately 0.5 to 20 ppm.
As a difficult-to-oxidise protein, BSA has been shown in other studies to have poor recovery and instrument response. These data demonstrate that heated persulfate oxidation technology is capable of thoroughly digesting and completely recovering the carbon in BSA samples over a wide working range. A similar plot with a secondorder best-fit curve would have been indicative of an instrument with incomplete recovery of BSA. The data often represent, in these cases, the upper limit of the robustness of the analyser to digest BSA; as the sample concentration increases, the instrument response stays relatively the same.
Table 2 further demonstrates the precision and accuracy obtainable with the Aurora 1030W when analysing proteinaceous samples such as BSA. For analysis, samples were prepared with known concentrations of BSA. From this, the theoretical carbon concentration could be calculated and compared with the measured carbon concentration. Based on the molecular weight of BSA as 66,317.25 amu and percent carbon by weight of 53.065%, one can correlate the carbon concentration to the concentration of BSA by the following formula:
ppm C = ppm BSA • 53.065
100
The data shows the capability of heated persulfate technology to analyse BSA samples with high accuracy (2.5% average percent RSD) and precision (87% average percent recovery).
Determining proper recoveries of carbon is a necessity in cleaning validation. The slope of theoretical versus actual concentration must be determined in order to obtain an accurate assessment of system recovery. In Figure 4, BSA recoveries determined in Table 2 are plotted and a slope is obtained.
Because theoretical carbon content is expected to be 53.065% in BSA, we can calculate the actual carbon content based on the equation that:
Theoretical TOC Concentration = Actual TOC Concentration;
Slope of the Line
for BSA, 53.065 = 46.8896% Carbon.
1.1317
By understanding the recovery that will be obtained by the analyser, a suitable range can be established for future runs to determine BSA content of unknown samples.
Summary and Conclusions
Developing an overall cleaning validation methodology is a substantial and detailed operation; the analytical method used to detect residues is only a small part. Using BSA as a model analyte that is well characterised and represents one of the most difficult-to-oxidise compounds found in the pharmaceutical industry, this study has determined that the Aurora 1030 TOC Analyzer is well suited for laboratory analysis of clean-in-place and cleanout-
of-place samples.
Heated persulfate oxidation technology and NDIR detection used in the Aurora 1030W, coupled with features such as 21 CFR Part 11 compliant software and a built-in report generating program, combine to provide the pharmaceutical industry with a TOC analyser that analysts can employ with a high degree of confidence for cleaning validation testing.
1. ‘Current Good Manufacturing Practice Regulations’, Code of Federal Regulations, Title 21, Food and Drugs (General Services Administration, Washington, D.C., 1 April 1973), Part 211.67.
2. Jenkins, K. M., et al., ‘Application of Total Organic Carbon Analysis to Cleaning Validation’, PDA J. Pharm. Sci. & Tech. 50 (1), 6-15 (1996).
3. Carter, D.C.; Ho, J.X., ‘Structure of Serum Albumin’, Adv. Protein Chem. 1994, 45, 153–203.
IET 36.3 May


.jpg)
.jpg)


.jpg)