.jpg)
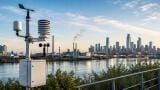
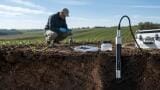
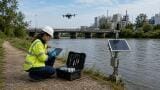
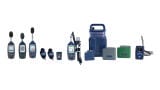
Portable & field testing
Whether it’s urban air quality, river contamination, noise pollution, or even soil conditions, real-time data needs to be translated, visualised, and displayed for the general public to see and act upon.
This growing trend is reshaping the way monitoring professionals think about software, sensors, and community engagement.
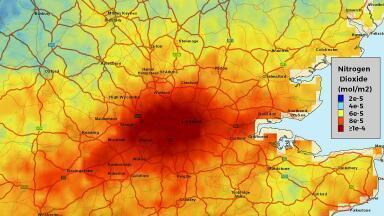
Environmental data is traditionally complex. Figures like PM2.5 concentrations, turbidity, or nutrient levels require interpretation.
Now, the challenge is to turn this information into something that is not only scientifically accurate, but understandable and actionable by everyday users.
Colour-coded street signs, interactive public dashboards, mobile notifications, and even augmented reality (AR) overlays are becoming critical tools in the environmental monitoring ecosystem.
This is why we need software that makes environmental data intelligible to the public. These systems bridge the gap between the technical and the tangible.
They help people understand the health risks in their immediate environment, encourage behavioural change, and build trust in institutions.
For instrumentation users, this shift presents both a technical challenge and an opportunity to rethink the role of environmental data in public life.
Making environmental data meaningful to the public requires purpose-built software that goes beyond traditional dashboards. Here are four reasons why the software layer is now as important as the hardware:
In short, intelligibility is a technical design goal. Making environmental data accessible and understandable is a software problem as much as a scientific one.
To meet these needs, software must evolve across several key areas:
Each of these developments is crucial for achieving the central goal: making complex environmental data intelligible to non-specialists while maintaining accuracy and credibility.
Several companies and platforms are already pushing boundaries in this space.
AirGradient Dashboard offers open-source tools for low-cost air monitors with transparent data visualisation and API integration.
IQAir (also known as AirVisual) provides global real-time air quality maps and apps with engaging, intuitive interfaces for the general public. Clarity builds cloud-based air quality monitoring platforms with custom dashboards and city-level deployments.
ThingsBoard is an open-source IoT platform supporting flexible public and administrative dashboards. Kaa IoT develops smart-city compatible platforms enabling real-time air and environmental data visualisation.
iLotusLand delivers integrated environmental monitoring and visualisation platforms, primarily for industrial and municipal clients.
Safecast is a community-driven project focused on radiation and air quality mapping with global reach and open APIs.
Public Lab offers open-source hardware and software tools for grassroots environmental monitoring.
EPA EJScreen is a US government tool that combines environmental and demographic data for justice-focused visual analysis.
Each of these examples highlights how software design choices impact the intelligibility of environmental data for diverse audiences.
These innovations are all part of the same project: making environmental data intelligible and trustworthy for everyday users.
Public-facing environmental displays are no longer niche experiments. They are becoming integral components of urban planning, health policy, and civic engagement.
For environmental instrumentation users, the challenge is evolving: to provide not just accurate measurements but meaningful, public-ready insights.
As the tools for communication improve, the value of monitoring data will grow, not just for scientists and regulators but for everyone who breathes the air, drinks the water, or walks the streets of a changing planet.
Software that makes environmental data intelligible to the public may prove a necessity for empowering communities, shaping policy, and safeguarding health in an increasingly data-driven world.
IET 36.2 Mar/Apr 2026


.jpg)