Environmental laboratory
Published over 6 years ago. See the latest and most current information on Environmental laboratory.
The aim of this application note is to demonstrate the quantitative performance of the Thermo Scientific™ TriPlus™ 500 Gas Chromatography Headspace (HS) Autosampler for the determination of gasoline range organics in water.
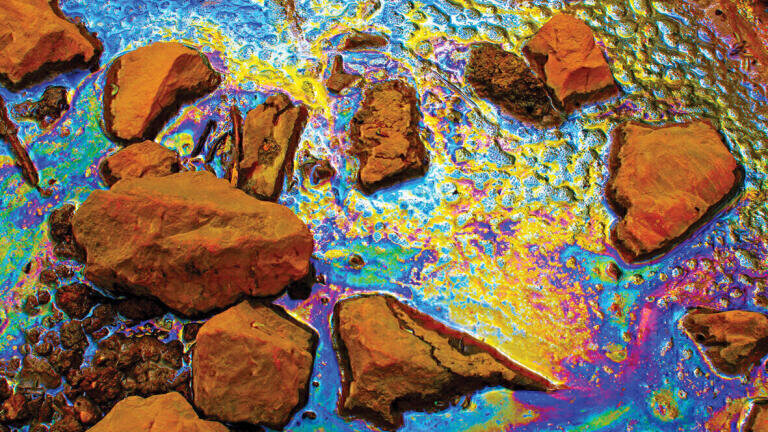
Gasoline range organics (GRO) refer to hydrocarbons with a carbon range from C6 to C10 that have boiling points ranging from 60 °C to 170 °C. These chemicals are often present in the environment, especially in ground water and soil, mainly as a consequence of contamination incidents. The source of contamination can be human errors and accidents (such as oil spills) that occur when handling, storing, or transporting oil and oil products. If GRO are detected, the level of contamination needs to be determined by using quantitative analytical methods; therefore, this represents a routine application for environmental analysis laboratories. GRO are highly volatile compounds that can be easily extracted from the matrix without the need for time-consuming sample preparation. Therefore, the analytical technique of choice for this application is headspace sampling coupled to gas chromatography and mass spectrometry and/or flame ionization detection.
In this work, the headspace sampling technique coupled with gas chromatography-FID detection was employed to assess method sensitivity, precision, robustness, and linearity for quantitative assessment of GRO in water.
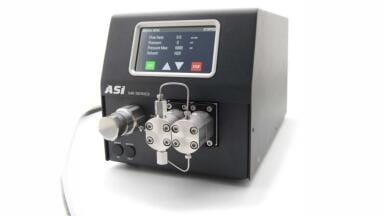
In all experiments, a TriPlus 500 HS autosampler was directly interfaced (without the need for an external transfer line) to a Thermo Scientific™ TRACE™ 1310 Gas Chromatograph equipped with a Thermo Scientific™ Instant Connect split/splitless SSL Injector and a Thermo Scientific™ Instant Connect Flame Ionization Detector (FID). Chromatographic separation was achieved on a Thermo Scientific™ TraceGOLD™ TG-1MS GC column, 30 m × 0.32 mm × 3.0 µm (P/N 26099-4840). Additional HS-GC-FID parameters are detailed in Table 1. The GC oven temperature program was optimized to reduce the analysis time and improve sample throughput; all peaks of interest elute in <13 minutes and the autosampler overlapping capability allows for long unattended sequences with automatic cycle time optimization.
Data was acquired, processed, and reported using the Thermo Scientific™ Chromeleon™ Chromatography Data System (CDS) software, version 7.2. Integrated instrument control ensures full automation from instrument set-up to raw data processing, reporting, and storage. Simplified e-workflows deliver effective data management ensuring ease of use, sample integrity, and traceability.
GRO standard mix at 1000 μg/mL was purchased from Restek (P/N 30095) and serially diluted using tap water to obtain seven stock solutions ranging from 6.25 μg/L to 10,000 μg/L (ppb). An amount of these standard stock solutions (5 mL) was transferred into a 10 mL crimp cap headspace vial (vials P/N 10CV, caps P/N 20-MCBC-ST3) and used to assess method linearity, sensitivity, recovery, and repeatability.
Unleaded petroleum was diluted with reagent water to produce a sample stock solution at 5% and kept refrigerated at 4 °C. The sample stock was used to evaluate the matrix recovery and the quantitative accuracy and precision.
Linearity was evaluated by injecting seven calibration levels at 6.25, 12.5, 25, 50, 1000, 2500, and 10,000 μg/L (ppb). A list of target compounds is reported in Table 2. Each concentration level was prepared and analyzed in triplicate (n = 3). The calculated correlation coefficients (R2) were 1.000 for all the investigated gasoline organics. Moreover, the residual values (measured as % RSD of average response factors) were <6.5%, confirming an excellent linearity (Figure 1).
The method detection limit is defined as the minimum concentration of a substance that can be measured and reported with 99% confidence that the analyte concentration is greater than zero.2 According to the Wisconsin method3 for GRO determination, the required limit of quantitation (LOQ) is 100 μg/L (ppb) or less for water samples and the method blank should not exceed a concentration of 50 μg/L (ppb). The method detection limit (MDL) was assessed analyzing n = 7 blank tap water samples (5 mL) and n = 7 tap water samples spiked at the concentration of 12.5 μg/L (ppb). MDL and LOQ were then calculated applying Equations 1 and 2, respectively.
The recovery was calculated using Equation 3 and was in the range 80% to 120%, with an average value of 105%. MDL, LOQ, and percent recovery results for the spiked samples are reported in Table 2. None of the investigated compounds could be detected in the tap water samples as shown in Figure 2.
(Equation 1)
MDL = t(n-1,1-α=0.99) * S
Where:
t = Student’s t-value appropriate for the single-tailed
99th percentile t statistic and a standard deviation
estimate with n-1 degrees of freedom, for
n = 7 injections: t = 3.143
S = standard deviation of the replicate analysis
(Equation 2)
LOQ = 10 * S
Where:
S = standard deviation of the replicate analysis
(Equation 3)
Average %R = (Cave/Csp) * 100%
Where:
Cave = average concentration of the spiked samples
Csp = initial spike concentration
To assess the method accuracy (%) in tap water samples containing raw gasoline matrix, 30 μL of the sample stock solution (prepared as described in the sample preparation section) were diluted into two flasks previously filled with 30 mL of tap water and fortified with the standard solution at a concentration of 1000 μg/L (ppb) and 10,000 μg/L (ppb). A blank matrix solution was prepared by adding 30 μL of sample stock solution to 30 mL tap water. Then, 5 mL of each fortified solution and the blank matrix were transferred into 10 mL headspace vials (n = 5) and analyzed to assess the recovery. The average recoveries (%) for the spiked matrix samples were calculated using Equation 3 and confirmed to be within 80–120% of the spiked levels with an average value of 96.5% (Table 3). Chromeleon CDS matrix correction feature allowed for automated subtraction of the background leading to a precise quantitation of the spiked samples.
Precision
System repeatability was assessed using n = 10 consecutive injections of tap water samples spiked at a concentration of 50 μg/L (ppb) and n = 10 tap water samples spiked with the 5% raw gasoline solution. Peak area %RSDs obtained for both assessments are reported in Table 4. Excellent repeatability was obtained for both standard and matrix spiked samples with an average %RSD of 0.91 and 1.1, respectively.
Tap water samples (5 mL, n = 10) were spiked with 1 μL of raw gasoline solution (5%) and analyzed. According to Wisconsin and EPA method 8015 C,4 GRO quantitation is based on a direct comparison of the total area within a defined retention time window to the total peak areas of the gasoline component standard. Therefore, the calibration curves previously plotted using the single component peak integration were calculated integrating the total peak area and used to quantitate the spiked water samples. The total area was obtained integrating all the chromatographic peaks within the retention time window ranged from MTBE (RT = 2.92 min) to naphthalene (RT = 11.96 min) according to the Wisconsin method and from 2-methylpentane (RT = 2.62 min) to 1,2,4-trimethylbenzene (RT = 9.25 min) according to EPA 8015 C method. The “baseline to baseline” integration did not include the solvent peak. Calculated correlation coefficient (R2) were 1.000 and the residual values (measured as % RSD of average response factors) were ~4% for both retention time windows confirming an excellent linearity. MDL, LOQ, and recovery were calculated for the total peak area calibration curves applying Equations 1, 2, and 3. Calibration curves and calculated MDL, LOQ, and percent recovery (total area integration applied) are shown in Figure 3. As an example, a chromatogram of a tap water sample (5 mL) spiked with raw gasoline solution (5%) (single component and EPA 8015 C total area integration) as well as the quantitation results obtained for the analyzed samples (single components and total area quantitation) are reported in Figure 4. A series of blank water vials (n = 5) was run after completing the sample sequence. No compound carry-over was detected in the blanks as demonstrated in Figure 5.
The results presented here demonstrate the suitability of the TriPlus 500 HS autosampler in combination with the Trace 1310 GC-FID for GRO analysis in environmental samples.
Excellent linearity with correlation coefficient R2 = 1.000 was obtained for all analytes. The Instant Connect Flame Ionization Detector (FID) allows sensitive detection of organic compounds as demonstrated by the calculated MDL and LOQ (average MDL = 1.4 μg/L (ppb) and average LOQ = 4.6 μg/L (ppb)).
The advanced Quick Spin Shaking (QSS) feature of vials and direct column connection to the valve manifold ensure efficient analyte extraction. In the experiments performed here, the average compound recovery for matrix spiked samples was >96%.
The low bleed and superior inertness of the TraceGOLD column allowed for highly reliable results. The high column efficiency allowed for a fast GC oven ramp supporting short analysis time (all analytes elute in <13 min) and high sample throughput to easily meet the needs of routine laboratories. Moreover, up to 240 sample vials can be accommodated into the trays for unattended 24-hour operations.
The pneumatic control and the sample path inertness of the TriPlus 500 HS autosampler ensure reliable and reproducible analyte injection and transfer. Average peak area RSDs (n = 10 consecutive injections) were 0.91% for tap water samples spiked with the standard solution at 50 μg/L (ppb) and 1.1% for tap water spiked with diluted raw gasoline.
The efficient purging of the pneumatic circuit of the TriPlus 500 HS autosampler eliminated potential for carry-over; no matrix components or gasoline organics were detected in the blank vials after a sequence of real samples contaminated with GRO chemicals.
Quantitation of spiked samples is simplified with the Chromeleon CDS advanced reprocessing features allowing for easy single component and total peak area integration and compound quantitation.
Overall, the data shows that the TriPlus 500 gas chromatography static headspace autosampler provides a reliable analytical tool allowing environmental laboratories to produce consistent results with outstanding analytical performance for GRO quantitative analysis in water samples.
Thermo Fisher Scientific, Chromeleon CDS Enterprise – Compliance, Connectivity, Confidence, BR72617-EN0718S.
EPA 821-R-16-006 Definition and Procedure for the determination of the Method Detection Limit, Revision 2, December 2016.
Wisconsin DNR, Modified GRO, Method for Determining Gasoline Range Organics, PUBL-SW-140, September 1995.
EPA Method 8015 C, Nonhalogenated organics by gas-chromatography, Revision 3, February 2007.
IET 36.3 May


.jpg)


.jpg)
.jpg)


2.jpg)