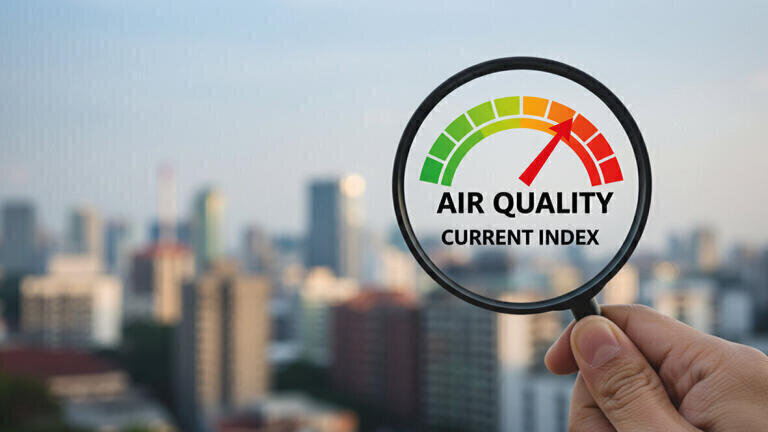
Air monitoring
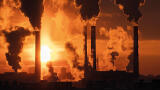
Due to a series of policy interventions, air quality in the UK has improved significantly since the middle of the twentieth century [1]. However, as the present annual mortality burden from air pollution indicates [2], the challenge of improving UK air quality is a current and pressing public health matter.
The EU Air Quality Directive [3] specifies target or limit values for the annual average concentrations of four heavy metals of particular concern (nickel, cadmium, arsenic and lead) in PM10 (particulate matter with a diameter of 10 µm or less) in ambient air to protect the health of the public. Particle number concentration, particle size distribution and black carbon are not yet regulated, but are recommended to be monitored.
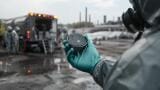
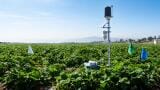
In the UK, compliance against these target and limit values is assessed by a number of air quality networks. The National Physical Laboratory (NPL) operates the Heavy Metals network, the Particle Numbers and Concentrations Network and the Black Carbon Network [4], for the Environment Agency on behalf of the UK’s Department for Environment, Food and Rural Affairs.
Through a series of case studies, we present and discuss how data and samples from the UK air quality monitoring networks have been used to deliver research activities that contribute to the wider understanding of air pollution in the UK. This demonstrates that these air quality monitoring networks provide a valuable and extensive data resource for policy makers, regulators, research, the public and other end-users.
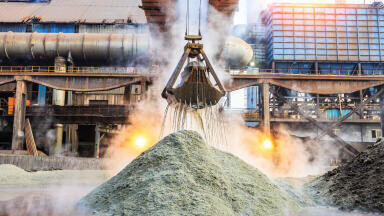
Lead isotope ratio analysis was carried out on more than 200 network samples to help identify sources of lead in ambient air [5]. Network sites in close proximity to steel or metal processing plants have the highest lead concentrations, but pinpointing at a higher spatial resolution is required to gain further information on source contributions.
Variation in lead isotope ratios from different anthropogenic sources can be measured to achieve this. A method was developed using tandem inductively coupled plasma mass spectrometry (ICP-MS/MS) to measure 206Pb, 207Pb and 208Pb. The method was validated against NIST SRM 891 isotopic lead wire.
Ten samples from each network site were analysed and site-type averages were taken. Sites generally form clusters based on the site type, with some exceptions (Figure 1). The outliers from site clusters and their comparison with literature values for pure sources give additional information on source contributions and will inform future site classifications.
A study was conducted to investigate changes in heavy metals concentrations across a year, and if such changes could be linked with variations in emissions [6]. Annual means were calculated, then normalised across each month, and a quadratic fit was performed across the year. The size of the coefficient of the second-order term represented the strength of the seasonality and the coefficient of determination, represented the goodness of the fit.
It was concluded that the balance between temporal emission profiles, particle size and weather drives seasonality in all heavy metal concentrations. Arsenic is strongly linked to combustion, and therefore predominantly emitted in colder months, when wind speed is higher and less atmospheric mixing occurs, meaning it does not travel far from the source.
In this case a ‘higher in winter – lower in summer’ concentration pattern was observed. Vanadium however is linked with heavy fuel oil combustion, and there is little seasonality in its emission rate. Higher temperatures in warmer months mean more atmospheric mixing and lower wind speeds, therefore vanadium travels further from its source in warmer months. Here a ‘lower in winter – higher in summer’ concentration pattern was observed.
Sites with aethalometers including the Glasgow, Birmingham and London urban areas and domestic emissions areas were selected to investigate trends in urban and roadside black carbon increments [7]. The roadside increment was calculated as the urban traffic contribution minus the urban background contribution, while the urban increment was calculated as urban background contribution minus the rural background contribution.
The most significant decrease in roadside increment in black carbon was observed in London, and the roadside increment in Birmingham was found to be higher than in London since 2020. Future measurement challenges include uncertainties related to measurements of low concentrations, instrumental noise and local pollution sources [8].
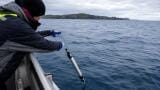
Environmental DNA (eDNA) has been recovered from network filter samples to assess biodiversity in the vicinity of the monitoring stations [9]. PM10 samples from Auchencorth Moss, a rural site, were compared with samples from Teddington, an urban background site, over varying time periods. Species richness was found to be highest over week-long sampling in Teddington.
Across the study over 180 vertebrate, arthropod, plant and fungal taxa were identified (Figure 2), showing that air monitoring networks are in fact gathering eDNA data, reflecting local biodiversity on a continental scale. This work was the first published study on using samples from air quality networks to assess biodiversity, and has the potential to transform global biodiversity monitoring using existing sampling infrastructure.
Biodiversity monitoring is currently typically performed using species specific methods, often by hobbyists, and with limited temporal and spatial coverage. Using air quality network samples can instead provide a continuous dataset with much wider spatial coverage.
More information can be found on the NPL website [4] and in our annual reports for Heavy Metals and Airborne particle concentrations, particle numbers, and black carbon [7,10]. All data from the UK Air Quality Monitoring Networks is publicly available online on the UK Air Data Selector [11].
[1] G. Fuller, The Invisible Killer: The Rising Global Threat of Air Pollution - And How We Can Fight Back, Melville House, 2018. https://guardianbookshop.com/the-invisible-killer-9781911545514/ (accessed March 3, 2025).
[2] EEA, Air quality in Europe 2021, Eur. Environ. Agency (2021). https://www.eea.europa.eu//publications/air-quality-in-europe-2021 (accessed March 3, 2025).
[3] European Parliament, Directive (EU) 2024/2881 of the European Parliament and of the Council of 23 October 2024 on ambient air quality and cleaner air for Europe, Off. J. Eur. Union (2024). https://eur-lex.europa.eu/eli/dir/2024/2881/oj (accessed March 12, 2025).
[4] NPL, Environmental Air quality networks, (n.d.). https://www.npl.co.uk/products-services/environmental/air-quality-networks (accessed March 12, 2025).
[5] E.C. Braysher, J.H.L. Cheong, D.M. Butterfield, A.S. Brown, R.J.C. Brown, Lead Isotope Ratio Measurements for Source Identification Using Samples from the UK Heavy Metals Air Quality Monitoring Network, Atmos. 2025, Vol. 16, Page 283 16 (2025) 283. https://doi.org/10.3390/ATMOS16030283.
[6] D.M. Butterfield, R.J.C. Brown, A.S. Brown, Seasonality of Heavy Metals Concentrations in Ambient Particulate Matter in the UK, Atmosphere (Basel). 15 (2024) 636. https://doi.org/10.3390/atmos15060636.
[7] K. Ciupek, E. McGhee, J. Tompkins, K. Williams, A. Brown, D. Butterfield, J. Allerton, C. Bradshaw, A. Lilley, V. Kantilal, C. Robins, B. Sweeney, R. Brown, M. Priestman, G. Fuller, D. Green, A. Tremper, Airbourne particle concentrations, particle numbers and black carbon in the United Kingdom - Annual report, (2022). https://uk-air.defra.gov.uk/assets/documents/reports/cat09/2309281150_PCN_BC_Annual_Report_2022.pdf.
[8] K. Ciupek, P. Quincey, D.C. Green, D. Butterfield, G.W. Fuller, Challenges and policy implications of long-term changes in mass absorption cross-section derived from equivalent black carbon and elemental carbon measurements in London and south-east England in 2014–2019, Environ. Sci. Process. Impacts 23 (2021) 1949–1960. https://doi.org/10.1039/D1EM00200G.
[9] J.E. Littlefair, J.J. Allerton, A.S. Brown, D.M. Butterfield, C. Robins, C.K. Economou, N.R. Garrett, E.L. Clare, Air-quality networks collect environmental DNA with the potential to measure biodiversity at continental scales, Curr. Biol. 33 (2023) R426–R428. https://doi.org/10.1016/J.CUB.2023.04.036.
[10] K.R. Williams, E.C. Braysher, J.H.L. Cheong, C.C. Robins, V. Kantilal, D.M. Butterfield, A. Lilley, C. Bradshaw, A.S. Brown, R.J.C. Brown, Annual report for 2022 on the UK Heavy Metals Monitoring Network, (2023). https://uk-air.defra.gov.uk/assets/documents/reports/cat09/2309281147_Metals_Network_Annual_Report_2022.pdf.
[11] DEFRA, DEFRA’s UK-Air: Air Information Resource, (n.d.). https://uk-air.defra.gov.uk/ (accessed July 10, 2023).
IET 36.3 May