Water/wastewater
Published over 5 years ago. See the latest and most current information on Water/wastewater.
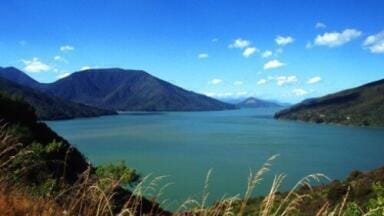
The north Kootenay Lake area of British Columbia, Canada has witnessed some turbulent weather and hydrological conditions in recent years. This has encouraged local people to mobilise in preparation for climate change, and they have founded the Kootenay Watershed Science (KWS) so they can grasp a better understanding on how the changing climate will affect their community.
The KWS project collects and shares important data to help them make the right decisions in terms of land use and development, conservation, emergency response, water supply allocation, among others.
So far, KWS has established two high-elevation snow course sites, three climate stations, and seven hydrometric stations. Data is collected on snowpack, precipitation, temperature, water quantity, and other measurement parameters.
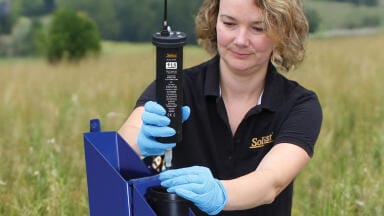
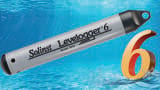
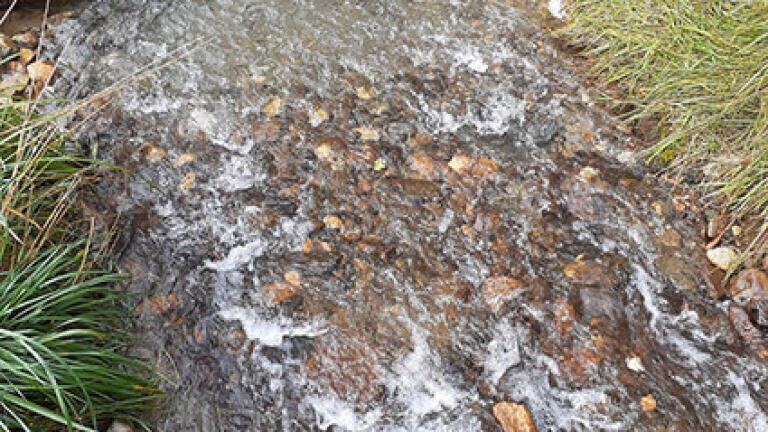
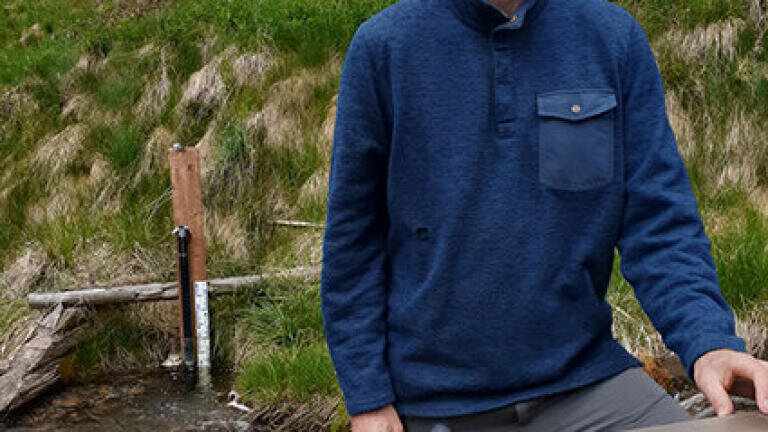
In 2012, Solinst Leveloggers water level dataloggers were deployed in five KWS hydrometric stations, with two more were added at stations in 2017. These Leveloggers are placed in streams in either a perforated PVC or steel pipe, along with a staff gauge.
The Leveloggers log water level and temperature every 15 minutes to provide a detailed account of water level fluctuations. The frequency enables them to download the data just twice a year.
Paul Saso, Hydrologist with Kootenay Watershed Science, said that the decision to opt for Solinst’s Leveloggers was based on reputation, precision, reasonable price, and reliability.
Solinst have recently donated seven Leveloggers and Barologgers to replace the dataloggers that have been recording for almost a decade.
The data generated by the Leveloggers is used to calculate discharge in the streams. This data is converted to discharge by working out the relationship between stage and discharge. This is achieved by utilising streamflow measured at several different stages through time to create the stage discharge rating curve.
The information gathered by KWS is available via the Columbia Basin Water Hub; this provides quality-controlled water-related data via an open-source database developed and was launched earlier this year by Living Lakes Canada.
IET Guide 2026

 Product directory