Water quality monitoring
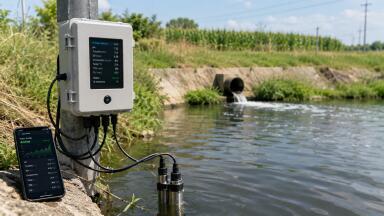
Bluelink from Aquaread, brings water quality data direct to users’ phones via the app, which is available to download on both Android and Apple devices from the relevant app stores, follow the links below to your preferred store.
Connecting a probe to Bluelink is completed within the app and is quick and reliable. Once connected, users can access the Settings tab at the bottom of the screen to configure any additional sensors connected to the AUX sockets.
Once configured, the live data tab at the bottom will show users’ all the current measurements from all fitted sensors. Pressing the view icon at the top of the screen allows users to switch between standard view, list view and graph view, where live graphs are generated as the readings refresh every two seconds. Fantastic for monitoring the stability of readings.
Bluelink enables users to calibrate all sensors fitted to their probe. The main calibration screen displays the date each sensor was last calibrated, along with the associated calibration report values. Selecting the icon next to the desired parameter opens its dedicated calibration screen.
Within this screen, users can view a live graph of the selected parameter and the current temperature measured by the probe. The live graph can be used to assess measurement stability, while the temperature display helps confirm stable conditions before calibration. Additionally, the software performs automatic stability checks and will only allow calibration once the measurements have reached a stable state.
Within the live data screens, users can set their preferred logging frequency and then either capture a snapshot of the current data or begin recording. Recorded data logs are stored in the Logs tab at the bottom of the screen.
Each data log is saved as an individual file that can be downloaded, shared, viewed, or deleted. When viewing a log, users can access graphical representations of the complete dataset for each parameter, enabling detailed analysis directly within the app.
Data sharing is straightforward, making use of the device’s native sharing options. For example, log files can be sent as CSV attachments via email or shared through other compatible applications.
IET 36.3 May


.jpg)


.jpg)