Chromatography
Published over 6 years ago. See the latest and most current information on Chromatography.
A major challenge facing environmental scientists is the generation of accurate meaningful data which shows how different gas compositions are changing within the atmosphere over short time frames. These measurements are being carried out on both global and highly localised levels in order to measure the long and short term impacts of greenhouse gases on the earth’s atmosphere. Methane currently makes up less than 5% of the total greenhouse gases globally which also include Carbon Dioxide, Nitrous Oxide and other fluorinated gases, making it more difficult to detect [1].
There are six major sources of atmospheric methane: emission from anaerobic decomposition in natural wetlands; paddy rice fields; emission from livestock production systems (including intrinsic fermentation and animal waste); biomass burning (including forest fires, charcoal combustion, and firewood burning); fossil methane emission during the exploration and transport of fossil fuels and anaerobic decomposition of organic waste in landfills [2].
This article will look at how gas chromatography (GC) can provide accurate data on methane levels in highly specific geographical areas. It will also look at the continuing role of the GC industry in measuring methane and the instruments which can be used to gather accurate data on emissions in the field.
Much environmental analysis is performed by GC due to compound volatility. The technological advances and growth in the development of chromatographic instruments in terms of their size, versatility and power (including GC, for environmental analysis) have accelerated as the general knowledge of the impact of climate change has increased in the past decades. There are typically two types of GC columns, packed and capillary. Capillary column GC first became commonly used in the late 1970s. The greatly increased separation efficiency of capillary columns compared with packed columns has resulted in their widespread use for oil, petrochemicals and environmental analysis to the extent that packed columns are now rarely used [3]. This is due to the accuracy of results and ability to be used in the field due to smaller, lighter instruments being developed. In parallel, with the development of more efficient, robust and stable columns, improvements in electronics and data capture reduced the relative cost of chromatography when compared to mass spectrometry as an analytical technique [3].
When conducting environmental research in the field a GC instrument gives positive confirmation of the compounds. Researchers can use two columns for extra confirmation that they are looking at the correct compound. When using GC for methane detection, a research team will traditionally run a sample on two columns of different polarity (e.g. polar and non-polar) to confirm the identity of a particular compound. This is not necessarily something that should be done in the field. Instead, it is more useful to identify compounds by comparing both retention times and detector response factors with known standards, which is the basis of a number of environmental methods [4].
Methane in air samples is measured using GC with FID. Typically, mass spectrometry is not suitable to carry out research in the field due to practical limitations when compared to lab research. Using GC for environmental analysis in the field relies on the retention of a specific compound on the GC column. The measurements are calibrated to the World Meteorological Organization standard scale, currently maintained by the National Oceanic and Atmospheric Administration (NOAA). Scale propagation errors are quantified by repeated measurement of standards [5].
An effective method of collecting field data by measuring atmospheric methane (CH4) levels is to focus on a single point or area where concentrations of methane are thought to be higher than the base levels. This can include an enclosed space, such as a chimney, or close to a valve or close to a landfill site. Exhaust systems can release methane through stacks; pneumatic valves and multiple discrete sources in both the petroleum and natural gas supply chains which emit methane as they operate [6].
One approach for measuring point sources is the use of ‘calibrated bags’, where the sample bag, when fully inflated, contains a known volume of gas collected over a known time period. These bags can then be taken off site to a lab for analysis later. This gives the advantage of not requiring an on-site lab and the ability for researchers to collect samples over a period of time. Another approach is to install suitable analytical equipment on site and to perform constant real time analysis, which is more practical than transporting samples to a lab and provides fast results. These discreet areas of emission point testing allow for accurate reporting of methane levels, as emissions can be collected and analysed over a period of time.
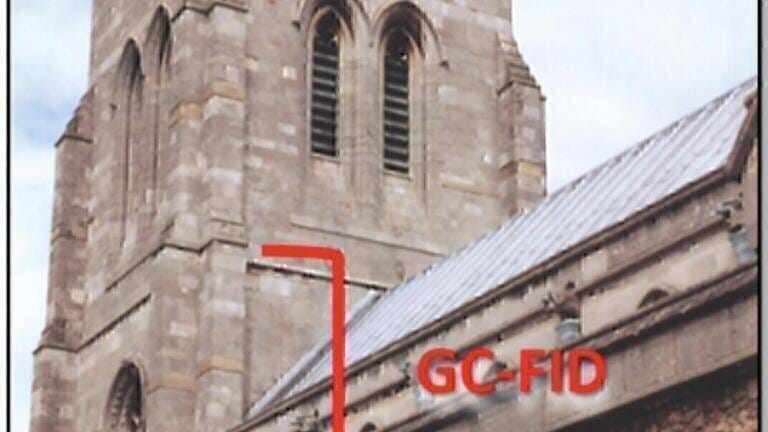
An example of this in practice is a study aimed at measuring CH4 levels in East Anglia – around landfill waste sites, where four specifically designed GC machines were installed in church towers which offered high points, protecting from the elements in a generally flat terrain. This in turn minimised any local fluxes which could have been recorded if the instrument was not in a protected space. It also ensured a wide data set was used to create an accurate picture of the methane levels across this area, reducing the risk of anomalous results.
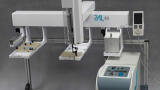
For this study, methane mixing ratios were measured every 75 seconds over the period July 2012 to July 2015 at four different churches in the East Anglia area, known in this study as the ‘East Anglia measurement network’. The measurements were taken using the same model of 200 Series Ellutia GC-FID to ensure consistency of results in this experiment [7].
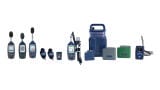
Before the experiment could take place, several bespoke 200 series instruments were developed to ensure the results provided would be as accurate as possible. The 200 series GC instrument was chosen due to its smaller footprint and more versatile configuration when compared to other larger GC models. The developer, Ellutia, worked to create a configuration of the 200 Series GC with a Flame Ionisation Detector (FID) attached, that would ensure methane-air separation could be achieved within the analysis cycle time required whilst giving results which were stable and reproducible.
The FID worked by detecting the ions formed by the combustion of a sample in a hydrogen/air flame. The introduction of air as a sample can affect the ratio of hydrogen to air within the flame and cause disturbances in the signal. In order to develop an instrument which would suit the needs of this experiment a number of challenges needed to be overcome. The length of the column was important to ensure good separation of the methane and the air present in the sample because of the disturbance to the FID the air can cause.
The sample size was important, if it was too small then the required sensitivity could not be achieved. If it was too large then the volume of air would potentially extinguish the FID flame. The choice of carrier gas was also important. Hydrogen was found to not give a stable enough baseline prior to the elution of methane. Nitrogen was found to greatly improve air disturbance, however, it also gave a negative response for methane, indicating the carrier gas had a higher concentration of methane than the sample. The quality of nitrogen could not be guaranteed unless a high purity nitrogen (6.0 Grade) was used. As such, helium was eventually chosen, as it offered minimal signal disturbance from the air and showed no other contamination of methane. Further adaptions were made to the instrument to allow for automated sample introduction and for remote ignition of the FID.
Using the adapted instrument, the air from outside the church was automatically analysed every 75 seconds. The GC instrument used in this experiment had a detection limit of approximately 1.5 ppb, and a range of 1.5 to 3 ppm.
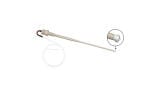
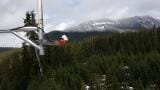
The instrument was calibrated every 30 minutes using a gas standard of 1.8ppm methane in air. The teflon inlet line was attached to the church roof 30 metres above the ground and was protected from the elements using an aluminium funnel and a 2 µm particle filter. The instruments locations are shown in images 1 and 2 below.
The data collected at each site was automatically transmitted back to the central laboratory for processing and analysis using a cloud-based data sharing system. Data processing of individual chromatograms was done using IGOR Pro (Wavemetrics, USA) to determine peak height. Measurements from all sites were calibrated to the WMO calibration scale with the hourly WMO calibrated mixing ratios then calculated using Openair in R [7].
One of the most interesting findings of the experiment saw several elevated CH4 measurements measured by the GC-FID in Haddenham church on a specific day (Figure 1). This happened during high winds from the south-east, which impacted the amount of CH4 measured in a way which was inconsistent with previous measurements. Air samples were collected in Tedlar bags at the same time and at the same location under the same conditions every 30 minutes and analysed later off site for CH4 analysis using a Picarro Cavity Ring-Down Spectroscopy (CRDS) instrument. The results showed a similar measurement between the Ellutia 200 Series GC-FID and Picarro CRDS. This confirmed the impact the high winds had on the levels of methane measured at the site on this specific date.
Figure 1. Methane mixing ratios measured by the GC-FID in Haddenham church on 11 February 2015 are presented in grey. Matching methane mixing ratios collected in Tedlar bags on 11 February 21015 and analysed on the 20 February 2015 using a Picarro CRDS at Royal Holloway, University of London, are presented as red points.
The measurements from Figure 2 were taken using the Keeling plot which is the isotope ratio of respiration in the absence of dilution by atmospheric CO2. The Keeling plot of the air samples taken at Haddenham church between 06:00 and 14:00 UTC on 11th February 2015 estimated the δ 13C isotopic signature at −58.3 ‰ (Figure 2). The typical δ 13C isotopic signature value for a landfill in the south-east of the UK has been estimated to be −58 ± 3 ‰. This is a clear difference between other possible sources for the methane measured and strongly suggests that the air measured at the church had come from a landfill [7].
To confirm the impact of the landfill on the results, air samples were taken closer to the landfill, 10 m from the active site [7].
Figure 2. Keeling plot of the air samples taken at Haddenham church between 06:00
and 14:00 UTC on 11 February 2015.
In another experiment, the average annual CH4 emission from the landfill as measured by the same GC instrument used by the churches as part of the experiment was calculated using ∼ 24,000 hourly averaged CH4 data. This was measured by the East Anglia network and Numerical Atmospheric-dispersion Modelling Environment (NAME) meteorological data in the Inversion Model Methane Emission Estimates (InTEM) model is estimated at 13.7 gigagrams yr−1. The results are shown in Table 1 below [8].
Table 1: Methane emission estimates from the landfill at the Waterbeach Waste Management Park as calculated by the WindTrax and Gaussian plume approaches for the case study and the annual estimates for the Gaussian plume and InTEM inversion modelling approach for 2012–2014. (8) WindTrax is a software for simulating atmospheric dispersion. Whereas the Gaussian plume approach is a mathematical model used to estimate the concentration of pollutants at a point at some distance from the source of emission.
A range of scenarios were run in WindTrax to investigate the uncertainty in CH4 emissions caused by the CH4 measurement, the wind speed measurement, estimating the roughness length and estimating the Monin–Obukhov length. Realistic uncertainty in the Monin–Obukhov length and instrument uncertainty for the CH4 measurement have little effect on the emission estimate. Uncertainty in estimating the emission area and roughness length have a noticeable effect on CH4 emission, resulting in an uncertainty of ±3 and ±4 % on modelled CH4 emissions, respectively. WindTrax has the greatest response to the uncertainty in estimating wind speed, resulting in an emission uncertainty of ±19%. The overall uncertainty in CH4 emission, calculated as the root of the sum of each component squared, is estimated at ±20% [8].
The measurements taken by this experiment relied on the development of a tailored instrument which was able to operate effectively in the field, taking data in real time
and feeding back analysis. This has allowed researchers to accurately track data in a
way which is stable and repeatable.
Field GC’s continue to play an important specific role in the identification and quantification of common pollutants in the environment, especially when focusing
on highly localised areas analysed in field research.
Industrial growth in developing countries and rapidly increasing air pollution levels are primarily responsible for the rising prevalence of the environmental testing application sector in the global GC market. Recent studies in this area have suggested global methane levels are on the rise although a reason is yet to be determined [9,10]. It is clear that GC will play a key role in providing an explanation to this growing global issue as landfill sites and ‘super-farms’ creating further methane output continue to grow in the coming years [10].
1. National Atmospheric Emissions Inventory – Overview of Methane Emissions - http://naei.beis.gov.uk/overview/ghg-overview
2. The greenhouse gas methane (CH4): Sources and sinks, the impact of population growth, possible interventions - https://link.springer.com/article/10.1007/BF02208779
3. Chromatography in Environmental Analysis – AWE Magazine – March 2009 https://www.aweimagazine.com/article/chromatography-in-environmental-analysis-333
4. Environmental Instrumentation Handbook – Gas Chromatography in Environmental Analysis - https://www.hnu.com/papers/GCEA.pdf
5. World Meteorological Organisation – Measurement of Atmospheric Compositions https://www.wmo.int/pages/prog/www/IMOP/publications/CIMO-Guide/Prelim_2018_ed/8_I_16_en_MR_clean.pdf
6. Improving Characterization of Anthropogenic Methane Emissions in the United States – Chapter 3 - https://www.nap.edu/read/24987/chapter/5#85
7. Estimating the size of a methane emission point source at different scales: from local to landscape – Cranfield University – June 2017 - https://dspace.lib.cranfield.ac.uk/handle/1826/12529
8. Carbon isotopic signature of coal-derived methane emissions to the atmosphere: from coalification to alteration - https://www.atmos-chem-phys.net/16/13669/2016/acp-16-13669-2016.pdf
9. WHO – How air pollution is destroying our health - https://www.who.int/air-pollution/news-and-events/how-air-pollution-is-destroying-our-health
10. Very Strong Atmospheric Methane Growth in the 4 Years 2014–2017: Implications for the Paris Agreement - https://agupubs.onlinelibrary.wiley.com/doi/pdf/10.1029/2018GB006009
IET 36.2 Mar/Apr 2026


.jpg)