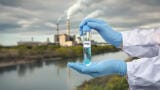
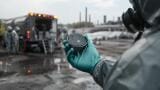
Air monitoring
Published over 6 years ago. See the latest and most current information on Air monitoring.
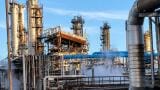
Finding sites for new infrastructure in a city is difficult and expensive. This is particularly true when there are tight restrictions on where equipment can be located in order to function. This location restriction applies to both local air pollution monitoring and high capacity wireless communications equipment and as increasing demand for data drives the introduction of 5G wireless communication the expected deployment densities of 5G networks start to look similar to the spatial variation of urban pollution (see figure 1).
The issue of securing enough cell sites has been a problem for wireless operators since GSM was rolled out in the mid 1990s and operators have become skilled at finding sites for their basestations. However, at the same time, land owners have realised the value of their buildings, bridges, poles and even oil company advertising signs at petrol stations. This has led to a steady rise in the cost of site rental as a proportion of a network’s operating costs; to the point where they now constitute between 40% and 50% of total operating costs. For comparison, the cost of the network equipment itself is only about 10% of operating costs. The same economic drivers are likely to apply to air quality monitoring networks so they will need to continually innovate to prevent site rental costs becoming unmanageable as sensor networks get denser to police increasingly ambitious urban air quality standards.
One line of innovation that has worked well for wireless networks is to reduce the physical size of basestations and combine multiple network functions into a single physical package. Another has been to enable the electronics of the basestation to be located some distance from the antenna. This works because the antenna, like the air sampling point, is the only part of a network that must be located in a specific place (to control how the wireless energy propagates across a city). Historically, the antenna could only be connected to the transmitter/receiver by coax cables that were short, bulky and expensive – rather like air sample tubes today – but heavy investment enabled a digital image of the signal to be sent 10s or 100s of meters over optic fibre with a minimum of conversion and amplification equipment located inside the antenna raydome. Similar innovations in sample tube design, including surface coatings and reliable characterisation of the tube, could enable actual air analysis to be performed where rental costs are lower, visual intrusion less, and maintenance access easier.
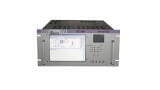
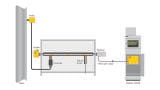
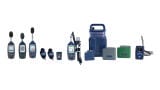
Figure 2 shows the range of sizes for air quality monitoring systems and wireless cell sites. It can be seen that both systems could be integrated without exceeding the weight limits for a single person lift or creating a major visual intrusion on the environment.
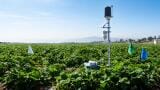
Pollution is highly local, not only in terms of the distance along the ground from a congested junction but also the height above the ground. Local variations quickly die away with height, particularly when it is windy, but people live mostly at ground level so these variations need to be captured. Many pollution monitoring sites are mounted on lampposts, perhaps 3-5 meters above the ground. This was historically rather low for wireless networks which provided wide area coverage from roof tops and high capacity data from micro basestations somewhat above the top of lampposts. As 5G (and other high capacity networks) are deployed the drive for dramatic increases in data capacity, combined with a slow increase in frequency allocations, has driven antenna heights down in order to use buildings to block the leakage of radio energy from one street to the next and so enable the same frequencies to be re-used many times in a small area. This offers the potential to combine air sampling points into antenna raydomes with consequent large cost savings since site rental agreements are generally priced on a per-box, not per-function, basis.
The cost of providing connectivity and power to a monitoring station is even more location sensitive than sampling. Running a cable across a busy road usually dwarfs the cost of buying an air monitoring unit and attaching it to a building or street furniture. Solar panels are a solution for power in many cases but snow in winter precludes this solution in some important cities so sites must be found with both data access and power. While the situation is improving it is still common that these factors dominate siting decisions for both air monitoring and wireless networks and combining sites can half the effective cost of providing services in cases where both networks can co-locate.
Here there can be a mismatch. Wireless basestations are visited perhaps once every 2-3 years whereas air monitor stations in some cities need the filters changed every 6 months. In cities with lower particulate levels the generally better air quality requires sensors to be more sensitive and accurate - which increases the need for regular calibration visits. Innovation over time is likely to extend maintenance periods but it will be necessary to design co-located sites to allow easy access to the pollution monitoring nodes without disrupting the operation of the wireless network.
The co-location of real time pollution monitoring stations and new 5G basestations is very feasible in many cases. Co-location reduces visual clutter in city centres, saves money for operators of both networks, and may improve public acceptance of these new networks because people who value air quality are not necessarily the same as those who value high speed internet access. A combined box has something for everyone.
You can also find the article at ttp.com/article.
IET 36.3 May


.jpg)