Water/wastewater
Published over 4 years ago. See the latest and most current information on Water/wastewater.
A world first sector-wide commitment was made by the UK water industry in November 2020 that water companies would deliver a net zero water supply to customers by 2030. This target is 20 years earlier than the UK Government target of 2050. The hope is that this commitment will set the standard for other sectors across the UK and around the world.
“Water UK and STOWA [the Foundation for Applied Water Research for the Dutch Water Authorities] are driving carbon reduction across the global water industry,” states Dr Mikkel Holmen Andersen, CTO at Unisense, Denmark, “not the UN.”
But how will the water industry achieve net zero by 2030? To put this into perspective, in the UK, the water industry uses 2% of national energy consumption and yet produces a massive one third of total national Greenhouse Gases (GHG) from its operations. The good news is that water companies have come together to tackle these emissions. Firstly, to produce a baseline of their GHG emissions using the same tool, then forecast a business-as-usual trajectory compared with the net zero option, to create a gap analysis to plan actions and measures. Water company net zero plans were published in July 2021. They have all committed to using the ‘emission reduction hierarchy’ which prioritises emission reduction over using renewables and lastly using carbon offsetting where needed to achieve net zero (Box 1). The UK water regulator, OFWAT, requires mandatory standardised reporting of operational carbon by 2022, and capital (embedded) carbon by 2023 by water companies.
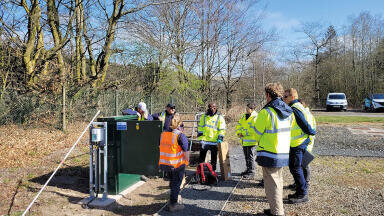
The first step is to understand where GHG emissions are coming from (box 2). Sensors and remote monitoring are used to measure GHGs. This monitoring data can then be used in software to predict and model emissions, which in turn can optimise performance to minimise emissions and reduce energy use (and save money which helps to make the business case).
“We are focusing on what we can control or influence, measures within our business plan, resilience to climate change, taking care of sensitive environments and embedding carbon culture into the company DNA,” says Dr Iris Soler, Head of Environmental Quality & Compliance at Southern Water, “We are also looking at how we can influence actions and behaviours through education and awareness campaigns to improve customers water consumption and water efficiency”. Dr Soler says that water consumption has increased significantly during the Covid 19 pandemic and needs to be brought back down to pre-Covid levels.
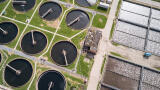
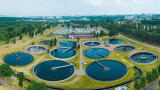
So where do water industry GHG emissions typically originate from? Both drinking water and wastewater activities consume much grid electricity which (depending on the mix of power sources) generates carbon dioxide i.e. indirect emissions produced by the energy providers. “In general, larger wastewater treatment works have greater process efficiencies due to economies of scale”, points out by Dr Steve Palmer, Process Engineer and Stantec; “the power demand and GHG emissions per population equivalent are less for larger wastewater treatment plant”. However, Mikkel Holmen Andersen, of Unisense says that larger wastewater treatment plant (WWTP) have higher emissions overall and more to gain by monitoring and controlling their emissions.
Many countries have already started decarbonising their electricity grid or have targets to do so. The proportion of power from renewable sources is increasing, so that over time the upstream, indirect CO2 emissions from power will decrease. However, companies can be more proactive than just waiting for this to happen by generating their own renewable power for their operations on site e.g. by installing wind or solar power. Carbon dioxide emissions from grid electricity can be tackled by purchasing 100% renewable energy from a reputable, certified renewable energy provider which can provide Renewable Energy Certificates (RECs) for each MWh. It is generally agreed that Scope 1 process emissions are now the main emission challenge to water industry net zero targets.
So if process or direct emissions (Scope 1) remain the largest remaining challenge to water companies, which factors need to be considered? Wastewater treatment processes produce large amounts of methane (with a Global Warming Potential (GWP) ~25 times greater than CO2), but also nitrous oxide (with a GWP of ~265 times that of CO2) (Figure 2). Minimising the production and release of these gases is obviously a priority. Biomethane (‘biogas’) can be collected and sold for injection into the natural gas grid. But although biogas production might appear to be a sustainable option, it actually can lead to increased production of nitrous oxide (a more potent GHG than methane) due to the low carbon and high ammonium levels present in the wastewater from the biogas production, as pointed out in the 2019 IPCC GHG update. So you would need to offset the harvesting of biogas in order to become carbon neutral.
“Process emissions are not yet well understood - the general view is that the UK water industry Carbon Accounting Workbook is underestimating actual process emissions of nitrous oxide and methane by a factor of 10,” highlights Dr Steve Palmer, Stantec “so the proportion of Scope 1 emissions is likely to shift from the current estimated baseline.”
International emission factors for estimating nitrous oxide emissions per total nitrogen load entering a WWTP also need more research, according to Dr Holmen Andersen, “The updated IPCC emission factor is 1.6% N2O-N/TNinlet but our monitoring at WWTP in Denmark has found emission factors varying from 0.24 to over 2.5% as many plants are already energy optimised and produce biogas, and the latest national emission factor for Denmark is 0.84% N2O-N/TNinlet with a spread between 0.24 – 1.24%” Dr Holmen Andersen expects that many UK WWTP will be similar.
“Using sensors to monitor nitrous oxide is key to understanding and controlling process emissions,” agrees Nick Blamire Brown, Technology Consultant at Isle Utilities. “Increasing emissions monitoring and modelling of any changes to processes allows operators to make informed adjustments to improve operational efficiencies”.
In terms of introducing mitigation meirisasures, it’s often easier to reduce emissions by improving existing technologies and systems e.g. efficient pump scheduling, than to change the whole process or technology used i.e. adding a new process to the treatment train says Mr Blamire Brown. But sensors play an important role in planning and evaluating the effectiveness of any interventions. For example, in Denmark, energy neutral WWTP (producing more energy than they consume) have typically saved 30% of energy through energy saving measures, and 70% of energy through real-time sensors, real-time controllability and advanced process controls. Isle Utilities has undertaken an evaluation of 183 of the available technologies to reduce carbon emissions in the water industry, focusing on process and fugitive emissions, a few of the shortlisted technologies are outlined below.
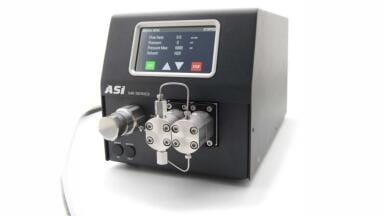
A game changing sensor developed in Denmark patented in 2012 is still the only nitrous oxide sensor in the world. Nitrous oxide makes up 8% of global GHG emissions and encompasses 26% of the emissions from the water sector and up to 90% of a single WWTP’s GHG emissions can be from wastewater treatment. Worryingly the N2O content in wastewater is projected to increase due to increased consumption of farmed food. The deammonification process in particular produces nitrous oxide (Figure 3). Even a single N2O sensor in one activated sludge tank is enough for some online, continuous, real time measurement and control of N2O emissions for the whole process, with calibration twice a month. “It is very important to measure N2O online and over a long time, because there will be fluctuations during each day, over seasons and even years, associated with temperature changes and process types,” reasons Dr Holmen Andersen, CTO at Unisense, “in my experience as much as 90% of N2O will be produced over the spring and summer months, when there is a higher turnover of ammonia.”
One way to reduce nitrous oxide production is by diluting the ammonia present by allowing higher levels of activated sludge in the mixed liquor than standard practice. At Biofos, the largest utility in Denmark, this reduced emissions of nitrous oxide by 80% which equates to the mitigation of 16,200 tonnes of CO2 equivalent per year (presented at IWA2021 conference, VARGA project, https://projekt-varga.dk/en/front/). Another mitigation method which has been piloted is to replace alternating nitrification and denitrification cycles with simultaneous cycles (Figure 4). After allowing the plant to adapt to the new regime, a 26% reduction of nitrous oxide emissions was achieved. In addition, air flow was reduced by more than 35%, leading to cost savings. The dissolved oxygen (DO) setpoint was reduced from 1.5 to 0.3 mg/l, whilst still meeting effluent quality standards. To achieve this level of advanced process control you need high frequency N2O monitoring data on a minute-by-minute basis.
A modelling programme can be used to model the risk of N2O emissions using historic SCADA data. Algorithms such as fuzzy logic can predict when emissions will occur in biological processes and which mitigation measures are needed to control them. Reductions of 40% and 70% in N2O have been achieved in 2 WWTP respectively, by implementing simple adjustments to DO set point values and basic operating rules. In Land van Cuijk, Netherlands, a reduction of 90% in N2O has been achieved using this risk model to: improve nitrification (reduce ammonia peaks); improve denitrification (reduce nitrate); and improve biological phosphorus removal (from better DO control) (Figure 5). This also resulted in a net reduction in consumption of grid electricity.
Rather than first trying to get perfect monitoring in place, Matt Gordon Engineering Manager (Digital) at Suez says in his experience it is best to use existing monitoring and start modelling and making iterative improvements to performance e.g. to optimise pump operation. “Rather than measuring twice and cutting once as is traditional, my motto is that you can measure once and cut [waste] twice,” says Mr Gordon.
“It has helped us enormously to use software which pulls all assets and sensing data into dashboards, for live predictive demand analysis and early warning of a weather event on its way or keeping track of assets which have been taken out of commission.” Says Chris Ames, Network Analyst and Hydraulic Modelling team lead at Welsh Water. Welsh Water has adopted modelling software already used by Northumbrian Water and Bristol Water which enables them to monitor pressure to create calmer networks with fewer pressure transients and monitor networks to get early warning of events before they hit customers.
Another way to achieve pump optimisation and asset management is to install a ‘dynamic pump optimisation process’ which uses edge analytics on operational data. By tracking pump and network conditions, the system can detect anomalies like upstream and downstream blockages. The system can provide recommendations to operators for action needed or operate in fully automated mode directly triggering corrective actions. In automatic mode it significantly reduces hydraulic transients. There are now more than 100 of these systems installed in the US.
Fugitive GHG emissions (accidental and unintentional emissions e.g. leaks and diffuse escapes), can be measured using aeroplanes installed with laser gas measurement (Differential Absorption Lidar or DIAL) developed at the National Physical Laboratory, UK. This produces more precise measurement than satellite monitoring using nano satellites (GHG Sat) which only measure to the nearest 25m. Alternatively, the Scentroid DR2000 Flying Lab is a drone installed with an intelligent chemical analyser and a choice of up to 6 sensors (out of 40 available sensors), which can identify not only the levels of gases present but also their 3D location.
Last but not least – a technology to look out for in future is the winning entry into the 2018 Melbourne ‘Emission Impossible’ innovation challenge, by Cranfield University and AECOM, who proposed an alternative treatment concept based on abiotic processes and anaerobic treatment which allegedly eliminates the production of Scope 1 emissions. The development and testing work has been held up by the pandemic, and we await an update on this exciting research.
And finally… Some ideas on how to get non-believers on board with achieving net zero, from Dr Steve Palmer and Dr Iris Soler:
• Compliance with reporting requirements for GHG emissions, to tie in with national and international GHG targets;
• Lay out the fact that we do not have a planet B;
• Reducing GHG emissions means improved resource efficiencies and operational efficiencies which lead to cost savings;
• Carbon pricing [polluter pays principle] will drive adoption of measures to GHG reduce emissions;
• The circular economy approach improves efficiency, sustainability and resilience to risks;
• Engage with individuals and listen to their expertise on how improvements can be made;
• Need to embed a ‘net zero decision making’ mindset across the company so that everyone is working towards the same goal.
And a final thought by Dr Palmer: “We really need policies to deliver national targets, for example regulation supporting the necessary transition for infrastructure – this would help to overcome barriers to investment that were identified by the UK Committee on Climate Change.”
IET 36.3 May


.jpg)


.jpg)
2.jpg)