Environmental Laboratory
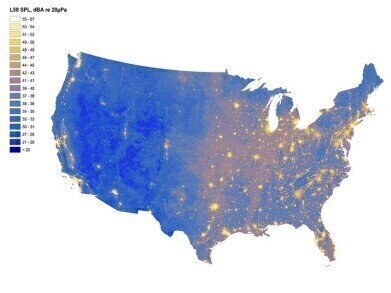
How to Map Noise Levels for a Whole Nation
Feb 28 2015
Whilst many people are often concerned with the noise levels in their own city or the area where they live, the noise levels away from them are often of little interest or consequence. However, in one of the largest studies of noise ever conducted, scientists at the National Park Services’ (NPS) Natural Sounds and Light Skies Division have recently put together a map which shows noise levels for every State in the USA. They unveiled the study and the map at the annual meeting of the American Association for the Advancement of Science.
The Why?
Before establishing how exactly the study took place and the relevant data was collected, it is important to understand why it was taken in such a way and on such a mammoth scale.
Of course, many people use noise levels to determine whether to buy a property in a certain area. London, for example, has its’ own noise level map which allows would-be property owners and tenants the opportunity of assessing the noise levels in a certain area prior to buying or renting a property there.
The noise level maps can also assist with industrial professionals who are either looking for quiet areas for their business, or who wish to be lost in a larger crowd of noisemakers.
An Urban Community is a local, intermunicipal government institution, regrouping cities over a large territory. Every year, its technical department carries out numerous studies and measurements dealing with the traffic of roads that constitute its network, in order to feed impact studies on urban planning projects. In order to meet the many demands of elected representatives, citizens and technical specialists regarding the noise issue, local authorities can deploy an extended long-term noise monitoring network over the main noisy areas of its territory. You can read more on this topic in this article: The Fundamental Contribution of Noise Measurement Networks.
Conservationists can also learn a great deal from noise levels as there are certain animal and plant species which thrive in quiet conditions but just as many who crave noise and bustle.
The How
In order to create the United States Map, the researchers collected over 1.5 million hours of recordings which were taken at 600 separate sites throughout the US. In doing so, they could compare and contrast the sounds heard at certain times during the day and assess the average noise levels for the area in question.
With this initial information, when taken over many days, weeks and months, they could also build a seasonal picture of noise levels. It stands to reason, for example, that an area which was heavily populated by birdlife would be noisier in Spring and Summer months than in those where the bird population would have migrated.
Although similar projects have taken place throughout the UK which have used similar methods to capture and record noise levels, the United States map remains the most ambitious project of its’ kind to date.
This could be set to change however as a similar project is expected to take place throughout the whole of the UK in order to map noise levels. However, a large-scale noise mapping project which takes into account cities with populations of 250,000 or over has already been completed by DEFRA to show traffic and industrial noise volumes. This project was undertaken as part of the EU Environmental Noise Directive (END) and any subsequent nationwide noise study would take part independently of this existing map.
Noise pollution at work
Worldwide, increasingly stringent regulations are coming into force limiting the exposure of workers to industrial noise. Over 1 million employees in Great Britain are exposed to levels of noise which puts their hearing at risk and 170,000 suffer from deafness, tinnitus – ring, whistling, buzzing or humming in the ears – or other ear conditions as a result of exposure to excessive noise at work. You can read more on this topic in this article: Sound advice on Noise Pollution.
Image Credit: National Park Service


Digital Edition
IET 34.2 March 2024
April 2024
Gas Detection - Biogas batch fermentation system for laboratory use with automatic gas analysis in real time Water/Wastewater - Upcycling sensors for sustainable nature management - Prist...
View all digital editions


Events
Apr 24 2024 Jakarta, Indonesia
Apr 24 2024 Sao Paulo, Brasil
Apr 30 2024 Melbourne, Australia
Apr 30 2024 Birmingham, UK
May 03 2024 Seoul, South Korea