Environmental Laboratory
Environmental Spectroscopy Brings the Measurement to the Sample
Dec 03 2013
Author: Rob Morris on behalf of Ocean Insight
Spectrometers have become smaller, faster and more powerful, making possible those applications once considered impractical outside the lab. In addition, where costly, process-grade spectrometers have been utilised in industry to monitor processes, finished goods and waste streams, today’s more compact fibre optic spectrometers can be installed directly into process lines to monitor similar parameters more cost-effectively and with greater flexibility.
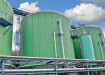
The idea of bringing the spectrometer to the sample has great significance in environmental technology, where testing and monitoring of the natural environment and resources benefits greatly from the ability to make real-time, in situ measurements (Figure 1). The same applies to the development of sustainable energy technologies such as photovoltaics and biofuels, where parameters can be monitored under conditions that match anticipated usage conditions.
The Evolution of CCD-array Spectrometers
Although many types of spectrometers have evolved in recent decades into more portable and powerful form factors, our focus here is on array-based spectrometers and their relevance to environmental technology. Let’s first consider silicon CCD-array spectrometers, which cover the UV, Visible and shortwave near infrared (NIR) wavelength regions.
When miniature spectrometers were introduced in the 1990s, they benefited from a perfect storm of technological circumstances: the development of detectors for mass-volume markets, which lowered system costs dramatically and allowed designers to make the instrument footprint much smaller than typical; the evolution of personal computers, which allowed spectrometers to process high-speed, high-resolution spectral data; and the growth of fibre optics, which made it much easier to bring the spectrometer to the sample.
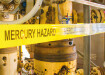
CCD-array miniature spectrometers today are often more than just a spectrometer. Components such as light sources and batteries can be attached to the spectrometer, forming a monolithic instrument. Also, because accessories have evolved to complement the portability of miniature spectrometers, low-power sources and streamlined sampling optics are readily available. Most importantly, microprocessors and displays can replace laptop PCs, making handheld operation possible and opening the door for the addition of wireless and similar capabilities (Figure 2).
Silicon CCD-arrays are limited by the inherent response of the detector, which typically starts at about 200 nm and cuts off at 1100 nm. For response farther into the NIR, several detector options are available, as well as different measurement approaches. Among the most popular of the array-based options is Indium Gallium Arsenide (InGaAs). InGaAs array-based spectrometers have response from ~800 nm-2500 nm, a wavelength region notable for the spectral response of water, organic compounds and materials of interest to environmental researchers.
While InGaAs-array based spectrometers are more expensive and somewhat less flexible than their CCD-based counterparts, they are still a viable option for a variety of environmental applications. What’s more, continued development of these spectrometers and alternative NIR technologies suggests that less expensive and even more flexible NIR instrumentation will be commonplace in the near future.
Examples of Environmental
Spectroscopy Applications
In the aftermath of the Deepwater Horizon oil spill that discharged millions of gallons of oil into the Gulf of Mexico in April 2010, researchers have poured over reams of data to monitor its effects on the environment. While most of the attention has focused on the Gulf waters, spectroscopic instrumentation has also been deployed to monitor the air quality in the affected areas.
While massive oil spills like the Gulf disaster certainly warrant worldwide attention, exposure to oil and similar chemical compounds affects the environment in smaller ways around the world every day. For example, one of our customers recently asked us to investigate the viability of fluorescence techniques to monitor oils used in cutting tool machine processes.
Fluorescence of Cutting Tool Fluids
Cutting tools generate heat and friction during the machining process. To improve the speed of machining and reduce tool wear, the cutting tool is bathed with cutting fluids that cool and lubricate the tool and machined part during use. While these cutting fluids are critical to the machining process, they can be harmful to workers and the environment. In the United States, the Occupational Safety and Health Administration (OSHA) has established guidelines for exposure limits with a detection method based on the inherent fluorescence of cutting oils. Similar occupational exposure limits for oil mists have been established by the European Agency for Safety and Health at Work (EU-OSHA).
In a recent experiment, we used a high sensitivity CCD-array spectrometer with UV-VIS excitation to determine if inherent fluorescence techniques are viable for detecting and identifying cutting oils.
Because of exposure concerns, the method for assessing and detecting cutting oils ensures proper performance and helps to detect leaks to avoid environmental contamination. Oils contain polycyclic aromatic hydrocarbons (PAHs) that have inherent fluorescence, with emission spectra and optimal excitation and emission wavelengths dependent on the chemical composition of the oil.
Fluorescence spectra were measured for five samples of typical cutting oils. The measurements were done to characterise the excitation and emission characteristics for the cutting oils and to determine if the cutting oils could be detected and identified based on their inherent fluorescence properties.
All measurements were performed using a spectrometer, scanning monochromator, pulsed xenon light source, 4-way cuvette holder and 1 cm quartz cuvettes. The monochromator was used to filter the broadband light source to provide narrow bands of excitation energy (~4.0 nm FWHM) across the range from 300-700 nm. The monochromator was tuned to multiple wavelength bands across the range from 300-700 nm and fluorescence emission was measured to determine the optimal wavelength for fluorescence excitation of each sample.
The 4-way cuvette holder was used to measure the samples in 1 cm quartz cuvettes containing 3.5 mL of each sample. The illumination and detection fibres were arranged at 90° to avoid detection of the excitation energy, and two mirrored screw plugs were added to the cuvette holder to increase the sensitivity of the measurement. All measurements utilised the same acquisition parameters of 4 second integration time, continuous strobe setting of 4 milliseconds, 1 scan to average and 0 boxcar smoothing.
The fluorescence spectra measured for the cutting oil samples are shown in Figure 3. All the spectra show differences in their inherent fluorescence response. These spectral differences are related to differences in the chemical composition of the cutting oils.
Table 1 summarises the fluorescence characteristics for the cutting oil samples. The optimal excitation wavelength was determined by scanning the monochromator across the wavelength range from 300-700 nm until the highest fluorescence emission was achieved. The unique fluorescence spectra -- along with the differences in excitation wavelengths, emission wavelengths and fluorescence intensities -- could be used to detect the various cutting oil samples and distinguish them from each other. This ability to differentiate the cutting oils by their fluorescence properties could be used to identify the source of a leak or environmental contamination.
As shown in the table, three of the samples (Samples 1, 3 and 4) had maximum emission with 487 nm excitation while the other samples (Samples 2 and 5) required different excitation wavelengths for maximum emission (531 and 351 nm, respectively). Note that even in the case of the samples with the same excitation wavelength, the spectral features are different enough to enable the samples to be discriminated from each other.
With the availability of modular spectroscopy components such as described here, the instrumentation could be taken to the site of the leak or environmental contamination, thus saving precious time and enabling more thorough characterisation of the extent of the contamination.
NIR Reflectivity of Photovoltaic Panels
With their modest cost, compact size and great flexibility, array-based spectrometers are attractive analytical tools for photovoltaic materials research and quality control. Typical applications include analysis of the optical properties of solar cell materials, spectroradiometric measurement of solar simulators used in panel testing and quality control in panel production. We recently evaluated NIR spectroscopy as a tool to measure the reflection properties of photovoltaic panel materials.
A manufacturer of thin film photovoltaics panels requested NIR reflectivity analysis of several coated glass samples. Measurements were conducted in the NIR range from 1200-2100 nm under ambient lab lighting conditions. Because the absorbance of photovoltaic panels is so critical, determining the reflectivity at panel edges and elsewhere is a good indicator of the light loss at those areas. The use of anti-reflective coatings and glass dopants are among the approaches manufacturers may evaluate in improving panel efficiency.
Five coated glass samples were analysed using an InGaAs-array spectrometer optimised for the range from 1200-2100 nm. The sampling setup comprised a high-powered tungsten halogen light source, 400 µm reflection probe and a reflection/transmission optical stage (fixture). A specular reflection standard with ~85-98% reflectivity from 800-2500 nm was used as a reference.
The glass samples were placed on the sample holder uncoated side down, to ensure that the probe was measuring the reflection from the coating through the glass. The optical stage helped to position the probe at 90º to measure specular reflectance. In specular reflection, the angle of incidence is equal to the angle of reflection. Specular reflection increases with the amount of gloss on a surface.
Measurements were taken under overhead lighting conditions, without use of a dark room or box. The high-powered (20 W) tungsten halogen light source provided continuous illumination from 360-2000 nm. The distance from the tip of the reflection probe to the surface of the sample was measured at ~7 cm for each sample, to simulate production conditions.
The measurements showed good stability. The reflection spectra for the supplied samples demonstrated that reflection values increased as a function of wavelength comparably across all five samples, peaking at about 2000 nm (Figure 4). Also, the gap between the least reflective and most reflective samples was relatively narrow at the lower and upper ranges of the spectrometer setup, with the greatest variation observed at approximately 1700 nm.
Reflectance intensity of the coated samples ranged from approximately 25% at the lower wavelengths to as much as 80% at the higher wavelengths. These values are relative to the response of the specular reflectance standard, which has nearly “flat” reflectivity across all NIR wavelengths.
As developers of photovoltaic materials continue to seek improvement in cell efficiency, the need for analytical tools that are convenient for evaluating glass coatings, dopants and other materials is great. Optical sensing systems such as NIR spectrometers, thin film measurement systems and solar simulator testing units are easily configured for both research lab and process line applications.
Environmental Spectroscopy Helps Change the World for the Better
The two examples described here are just the tip of the iceberg when it comes to the depth of environmental spectroscopy applications around the world. Thousands of applications are affecting us every day and will continue to affect us into the future, from the researchers investigating ozone levels atop Mt. Everest to the divers monitoring coral growth as an indicator of the health of our oceans.
There are even more potentially life-enhancing developments to consider. As growing populations strain resources worldwide, spectroscopy helps to improve and make more accessible applications such as water quality testing and sustainable energy source development, which are as critical to our future as social movements and political stability.
References
Fluorescent Dye-Tracing as a Cost-Effective Tool in Applied Contaminant Hydrology: A Case Study of Synchronous Spectro-Fluorometry in a Heavily Oil-Contaminated Aquifer; Otz, M.H., Hinchey, E., Siegel, D.I., Otz, H.K. and Otz, I., cited at http://info.ngwa.org/GWOL/pdf/pdf/041980211.pdf.
The OSHA fluorescence method for detecting cutting oils is described in Oil Mist in Workplace Atmospheres, available at http://www.osha.gov/dts/sltc/methods/partial/id128/id128.html.
Digital Edition
IET 34.2 March 2024
April 2024
Gas Detection - Biogas batch fermentation system for laboratory use with automatic gas analysis in real time Water/Wastewater - Upcycling sensors for sustainable nature management - Prist...
View all digital editions


Events
Apr 30 2024 Melbourne, Australia
Apr 30 2024 Birmingham, UK
May 03 2024 Seoul, South Korea
May 05 2024 Seville, Spain
May 06 2024 Minneapolis, MN, USA